Savant App - Energy Service User Guide
| Document Date: | February 2026 |
| Document Supports: | Savant OS 11.1 and Higher |
| Overview |
| 1. Energy Dashboard |
| 2. Dashboard Widgets |
| 3. Energy History |
| 4. Energy Scenes |
| 5. Push Notifications |
| 6. Energy Settings |
| 7. Firmware Updates |
Overview
This user guide describes Energy Dashboard functions and settings within the Savant app. To access the Energy Service, open the Savant App with a smart device and click Connect to enter the home. Tap the energy icon to open the Energy Dashboard. Energy only systems are taken directly to the Energy Dashboard.
1. Energy Dashboard
Tap the Energy icon displayed in the service carousel at the bottom of the Savant app Home screen to access the Energy Dashboard. This screen provides an overview of a configured Savant Energy System. The screen descriptions of the Energy Dashboard are described below.
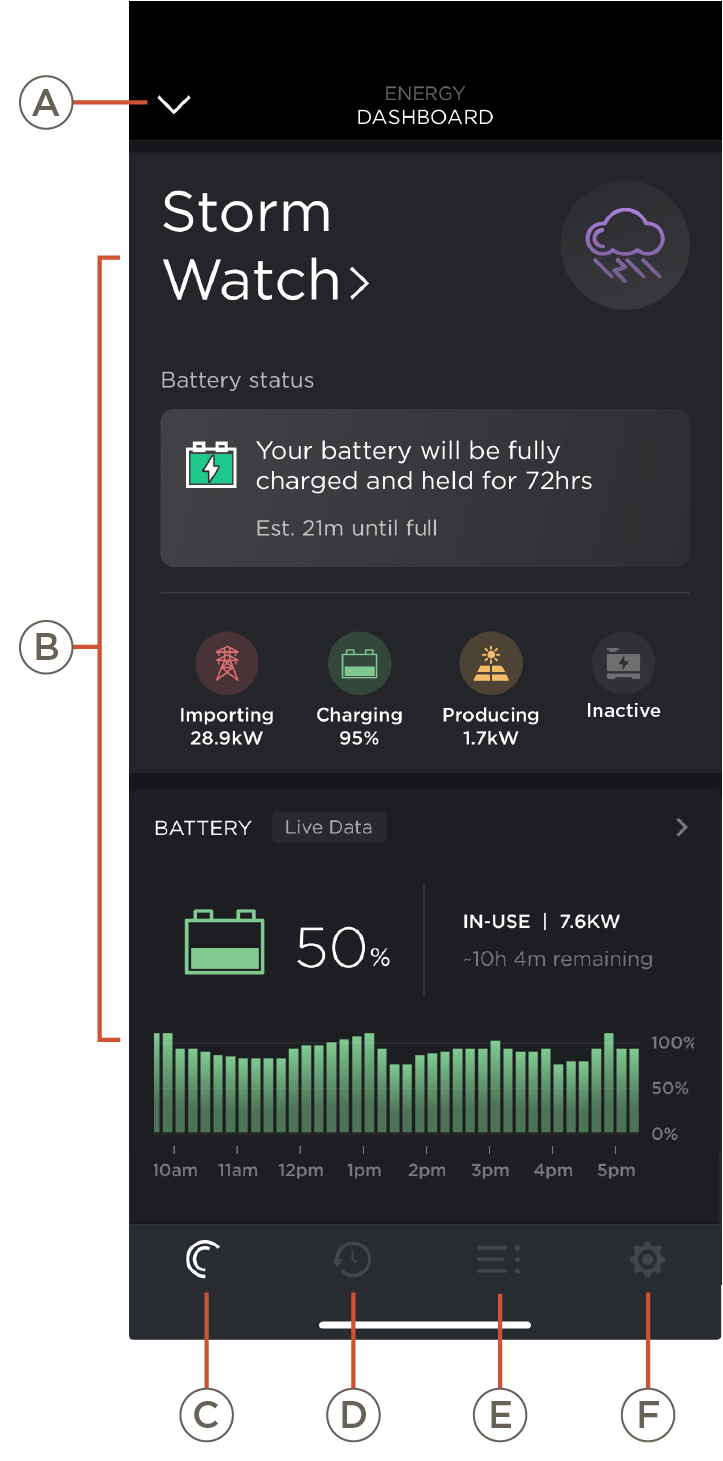 | A | Back Button | Tap to return to the previous screen. NOTE: The back button will not appear for energy only systems. |
| B | Widgets | A summary of data for different components within the energy system. See the Dashboard Widgets section for more information. | |
| C | Dashboard | Tap to access the Energy Dashboard screen. | |
| D | History | Tap to access the Energy History screen. This page displays power usage over time. See the Energy History section for more information. | |
| E | Load Control | Tap to access the Energy Load Control screen. This page displays load controls and loads status. | |
| F | Settings Control | Settings for energy only systems. |
2. Dashboard Widgets
Each widget provides a summary of data for different components within the energy system. Users can change the order of the widgets by tapping and holding the widget and dragging it to its new position within the dashboard. Not all widgets are available for all systems. See the sections below for more details.
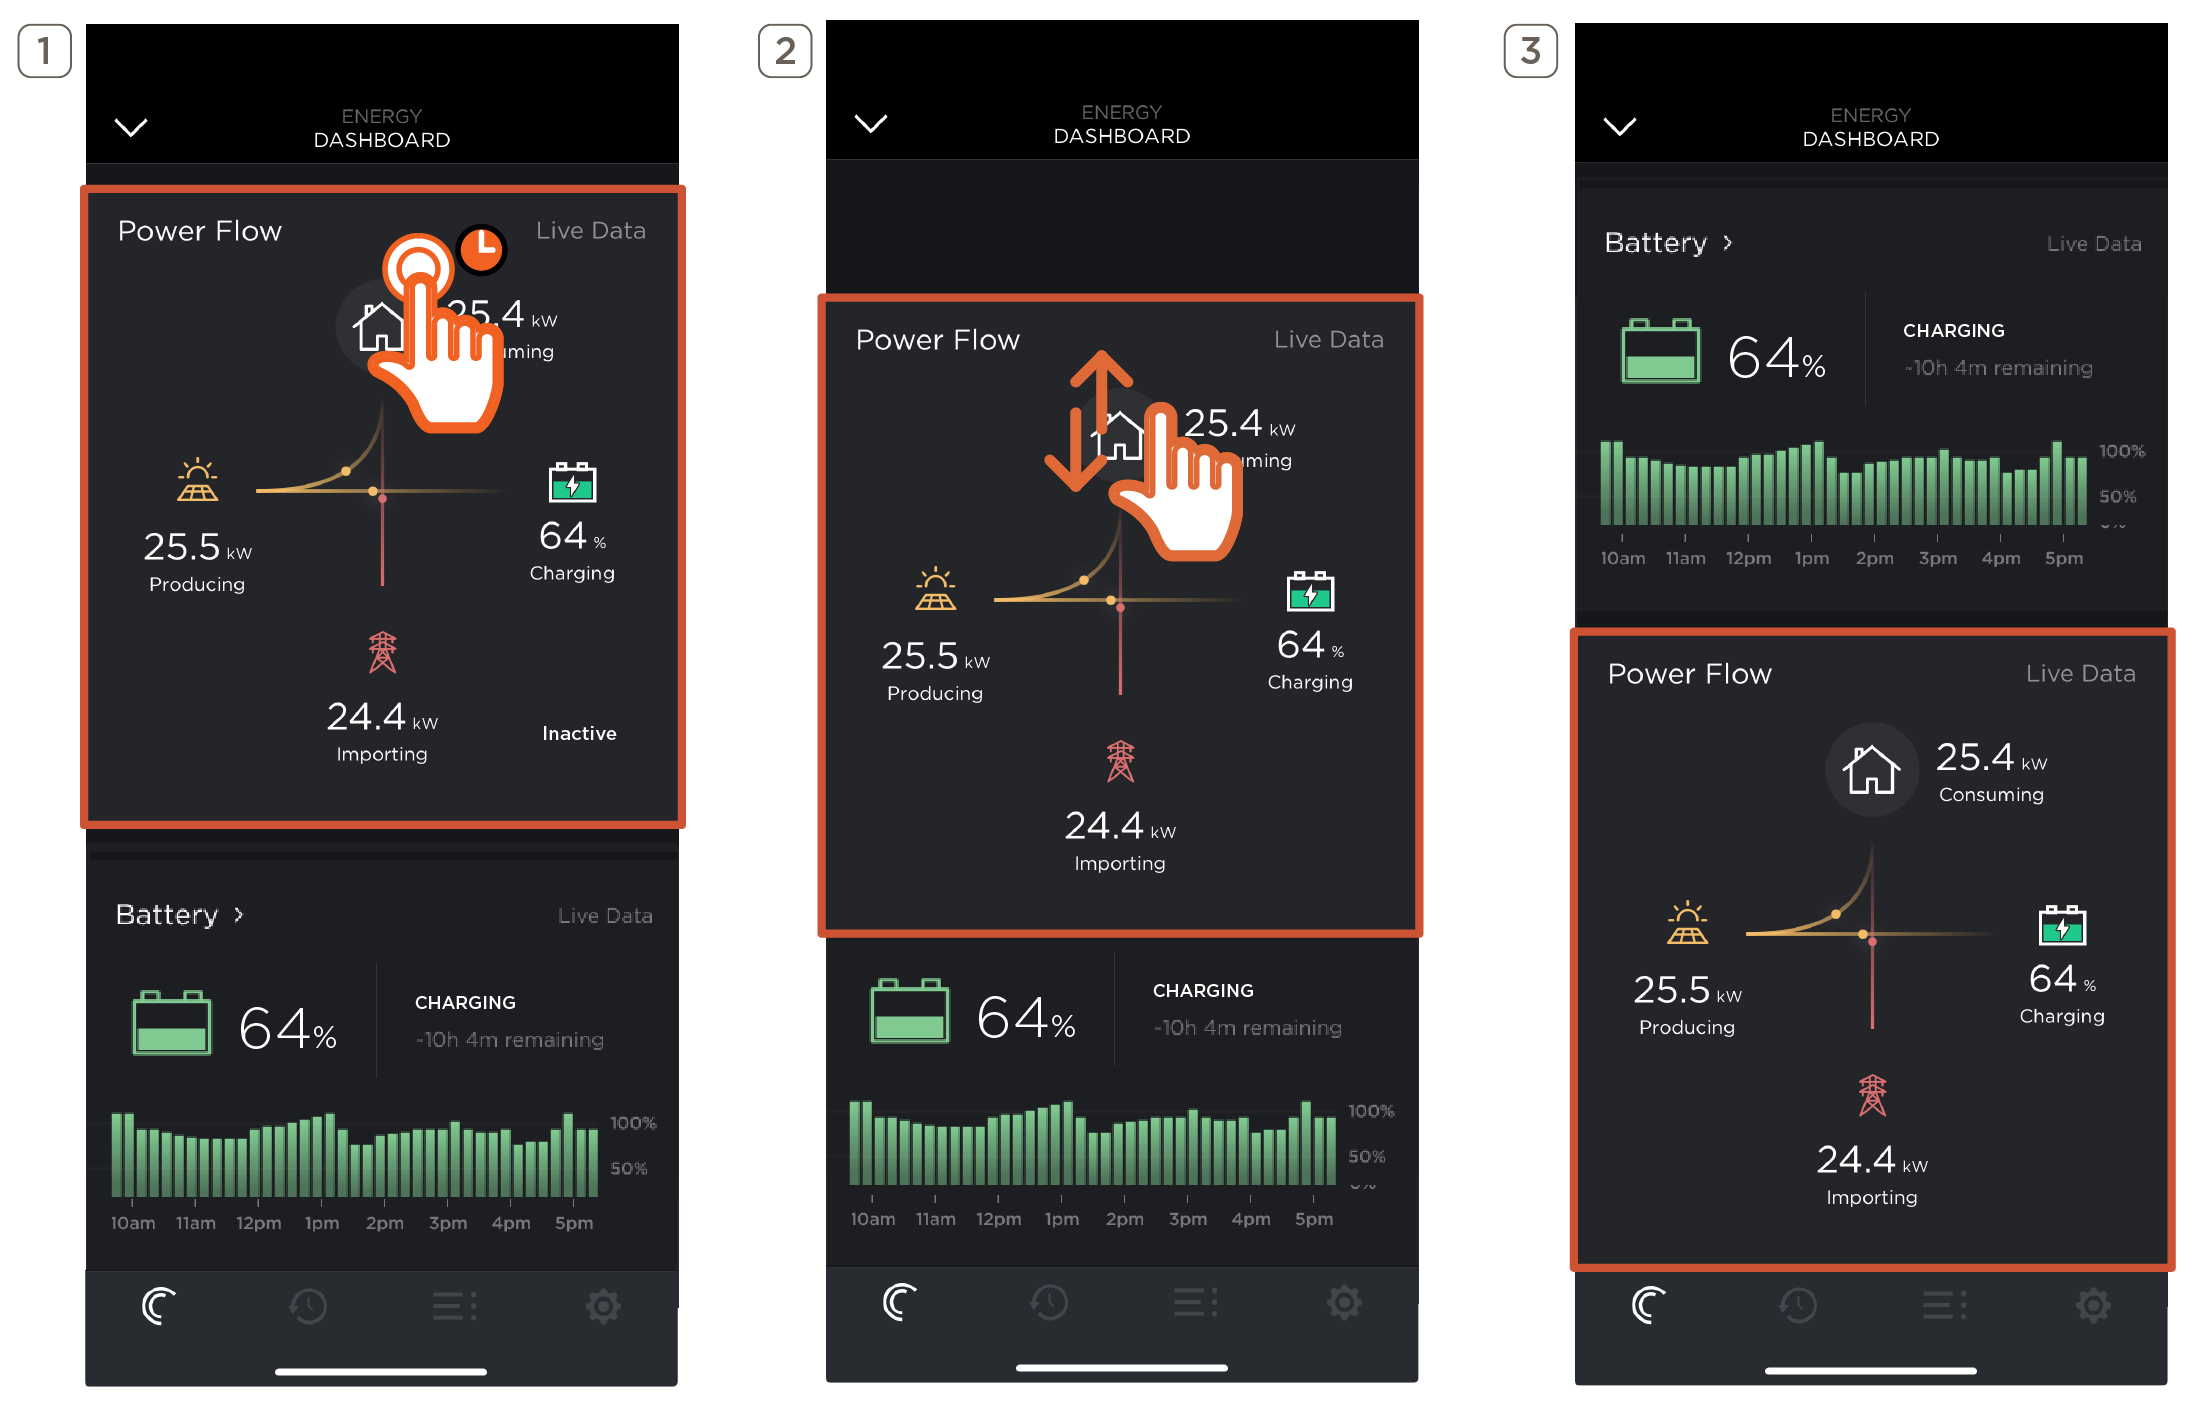
- Tap and hold the widget.
- Without releasing the widget, drag it to its new position.
- Release once the widget snaps to the new position.
Battery Widget
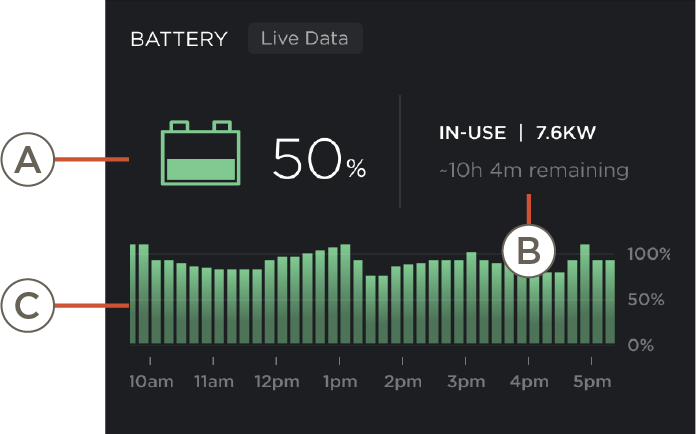 | A | Battery State of Charge (SoC). |
| B | Operating mode of the battery (e.g., charging, in use), battery power in kW or W, and estimated time until fully charged or estimated time remaining until the battery is drained. | |
| C | Battery SoC throughout the day. |
Circuit Control Widget
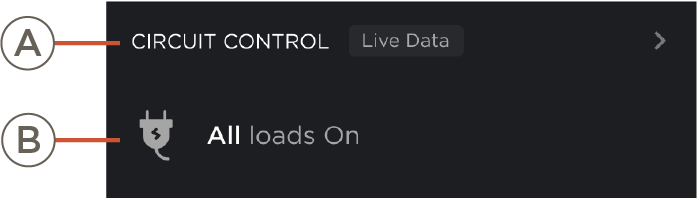 | A | Tap to access secondary page with a full view of loads sorted by room and group. |
| B | Displays a summary of load status (enabled, disabled). |
Energy Scene Widget
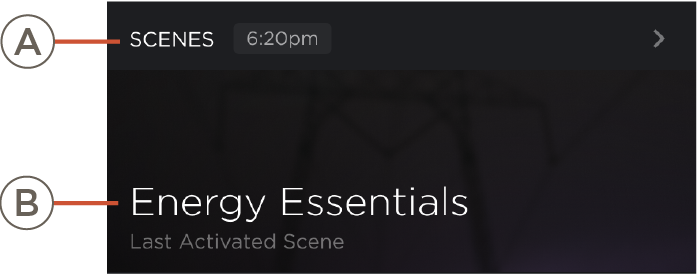 | A | Tap to access secondary Energy Scenes page. See the Energy Scenes section for more information. |
| B | Name of last activated Energy Scene. |
EV Chargers Widget
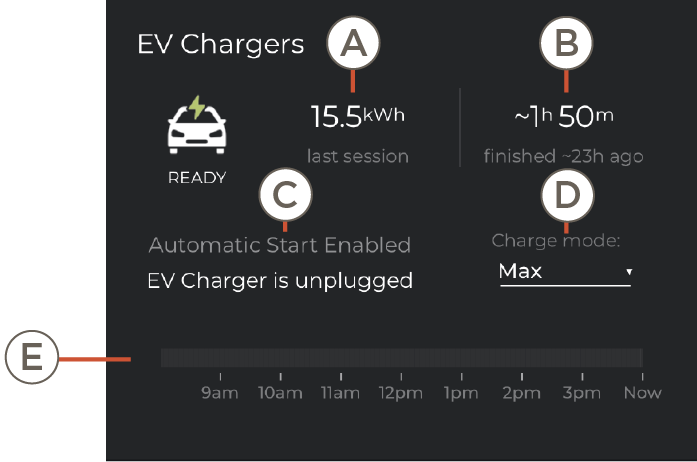 | A | Total energy supplied to the EV during the last charging session. |
| B | Duration of the active charging session or the duration of the last charging session. (If not actively charging) | |
| C | Automatic Mode / Manual Mode:
| |
| D | Charging modes:
| |
| E | EV charger useage throughout the day. |
Generator Widget
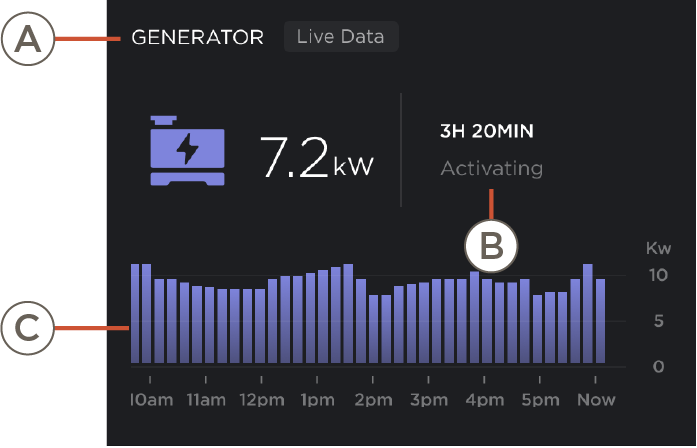 | A | Live power output of the generator. |
| B | Duration the generator has been running (pictured) or the date the generator last ran. | |
| C | Generator use throughout the day. |
Live Energy Consumption Widget
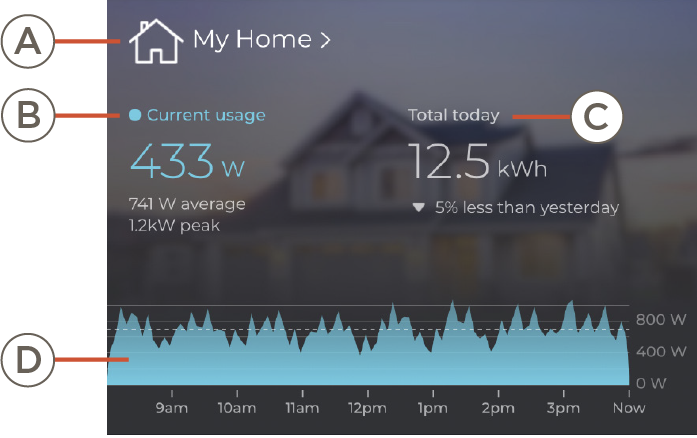 | A | Tap to access secondary Energy History page. See the Energy History section for more information. |
| B | Live power use. Also displays the average power use and peak power use. | |
| C | Total energy used today, and a comparison of the total energy used yesterday. Also compares power use from the previous day. | |
| D | Use of power throughout the day. |
Load Status Widget
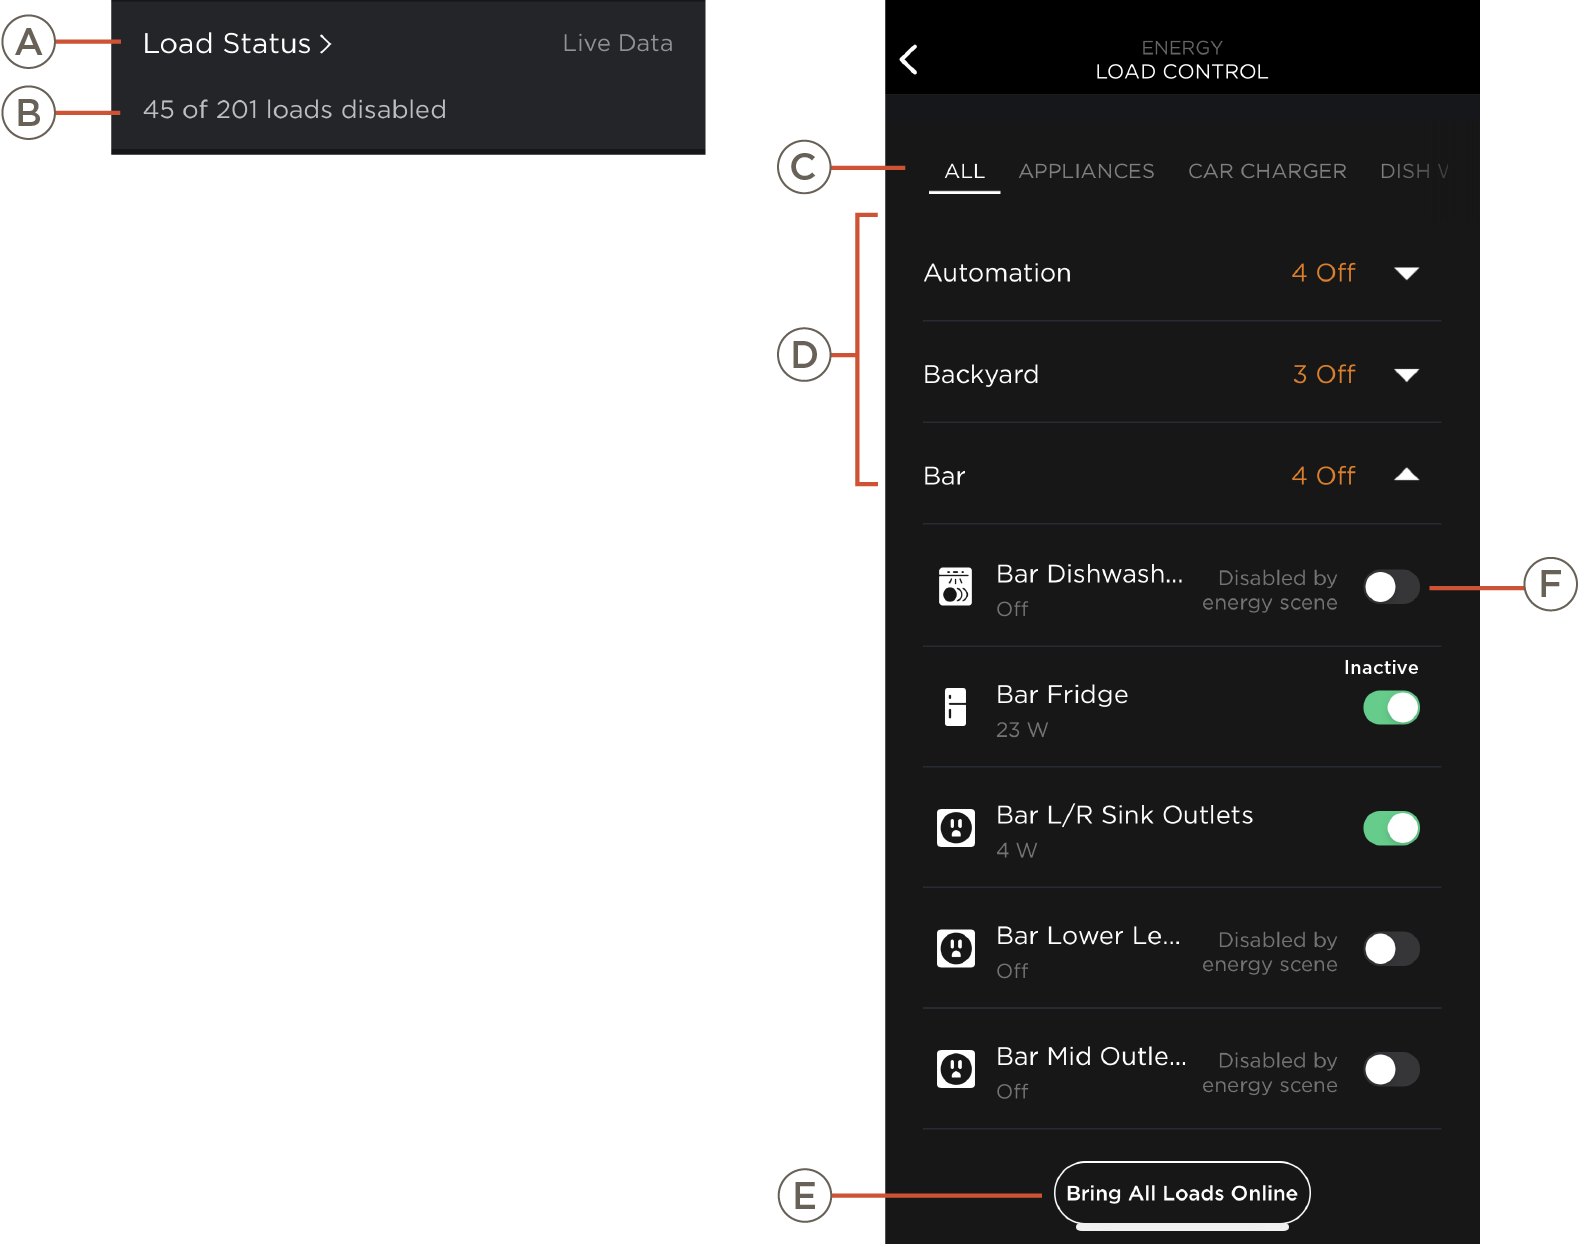 | A | Load Status | Tap to access secondary page with a full view of loads sorted by room and group. See the Load Control section for more information. |
| B | Loads | Displays a summary of load status (enabled, disabled). | |
| C | Groups | Load control, organized by rooms within groups. Swipe left or right to access all groups. | |
| D | Rooms | Select the down arrow on a room to see all loads available within that room. The user may turn on/off a power load from here. | |
| E | Bring All Loads Online | Turns all loads on within the group selected. | |
| F | On/Off | Toggle to turn on/off the load.
|
Power Flow Widget
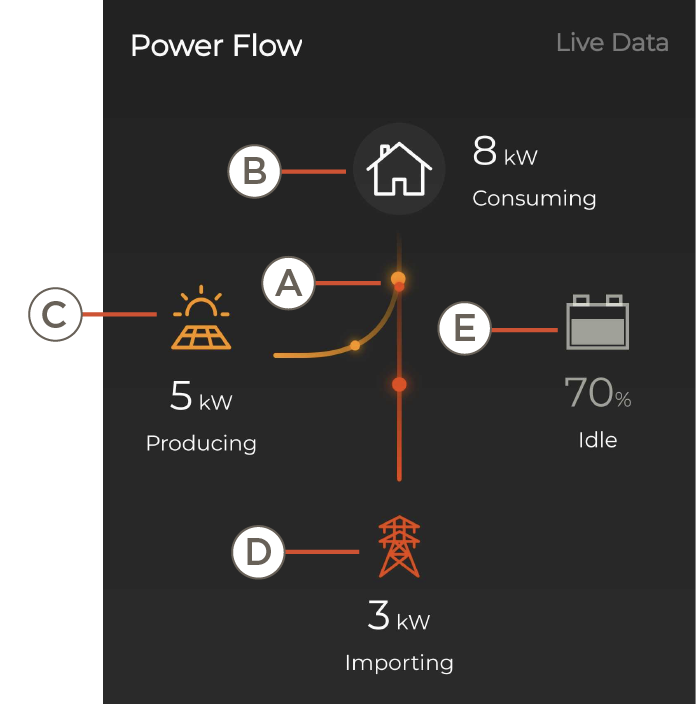 | NOTE: The Power Flow Widget only appears for microgrid systems. This widget will not appear for solar only systems. | |
| A | Visual representation of the Power Sources in the home (solar, battery, grid) and the corresponding power input/output. | |
| B | The amount of power being used (kW). | |
| C | The amount of power being produced (kW) from solar. | |
| D | The amount of power being imported or exported to/from the grid (kW). | |
| E | Battery status (e.g., charging, in use) and battery SoC. | |
Status Widget
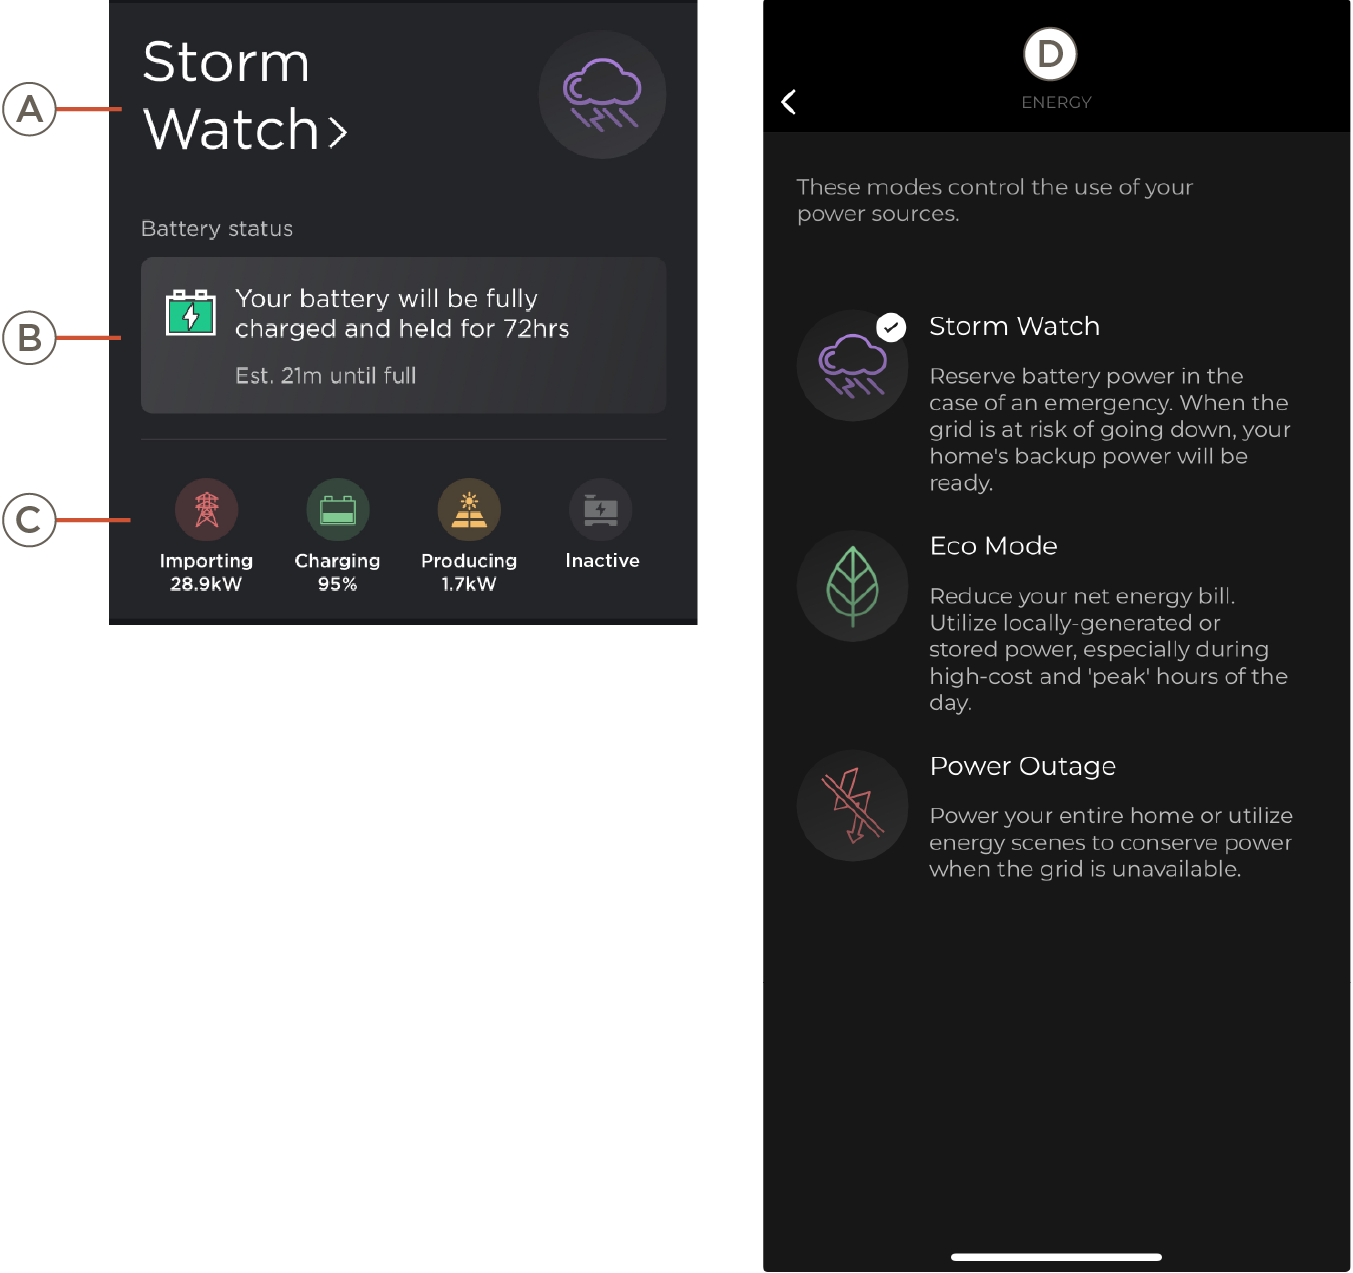 | A | Active Energy Mode / Active Energy Scene: Visual representation of the Power Sources in the home (solar, battery, grid) and the corresponding power input/output. |
| B | Battery life or estimated time remaining until fully charged. | |
| C | List of all Power Sources in the home and their states. | |
| D | Modes (Only supported for systems with PS20 or PS50):
|
Top Consumers Widget and Page
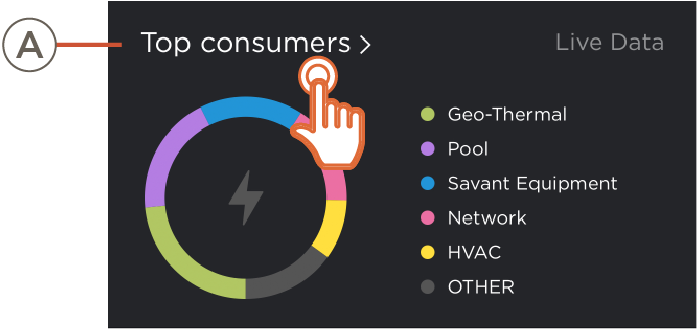 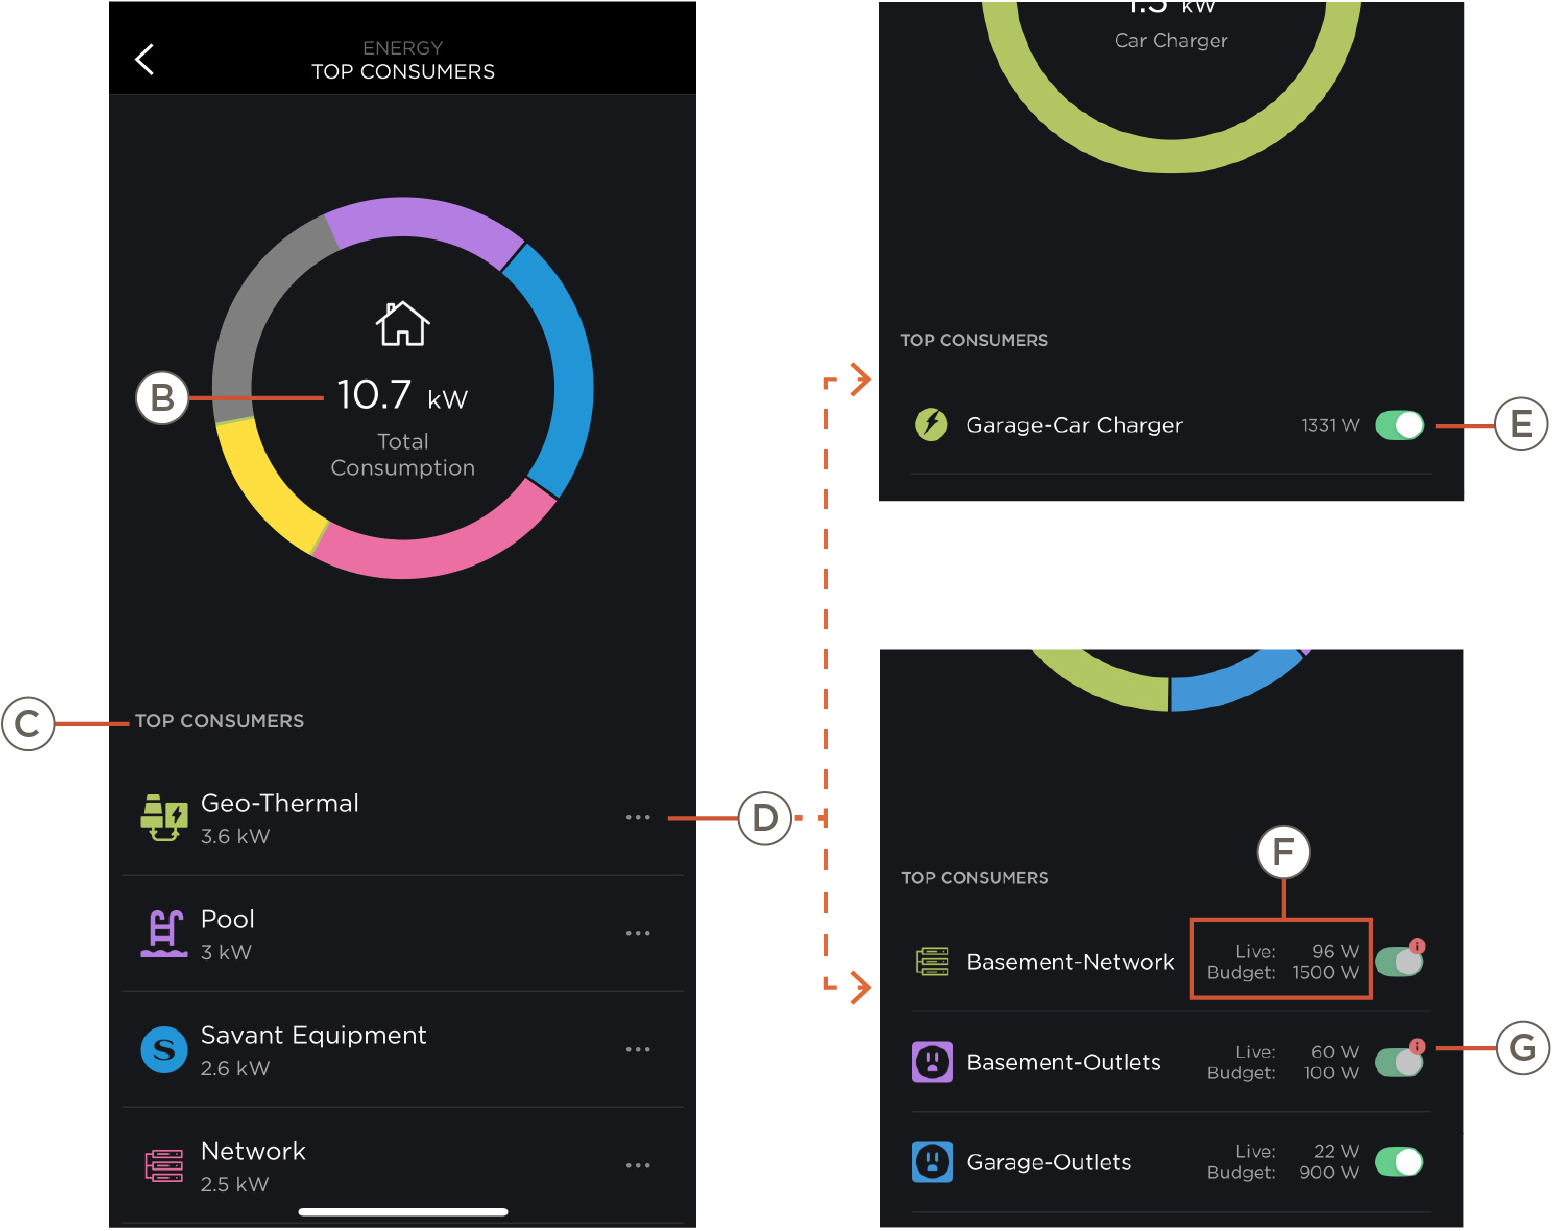 | A | Top Consumers Widget | Highest energy consuming Loads. Tap on this widget to access the Top Consumers Page. |
| B | Top Consumption | Total Consumption of all Power Sources in the home. Users can select portions of the chart to highlight which load it corresponds to. | |
| C | List View | All the load groups in order from using the most energy to the least. | |
| D | Top Group Consumption | Tap on the ellipses (...) to access the group's Total Consumption. This displays a list of all power consumers in a group from most usage to least. | |
| E | On/Off | Toggle to turn on/off the entire load.
| |
| F | Live and Budget | Live and Budget readings (Partial Home systems only)
| |
| G | Forced On | The load was forced on. (Non-budgeted systems only) |
Message Center Widget and Page
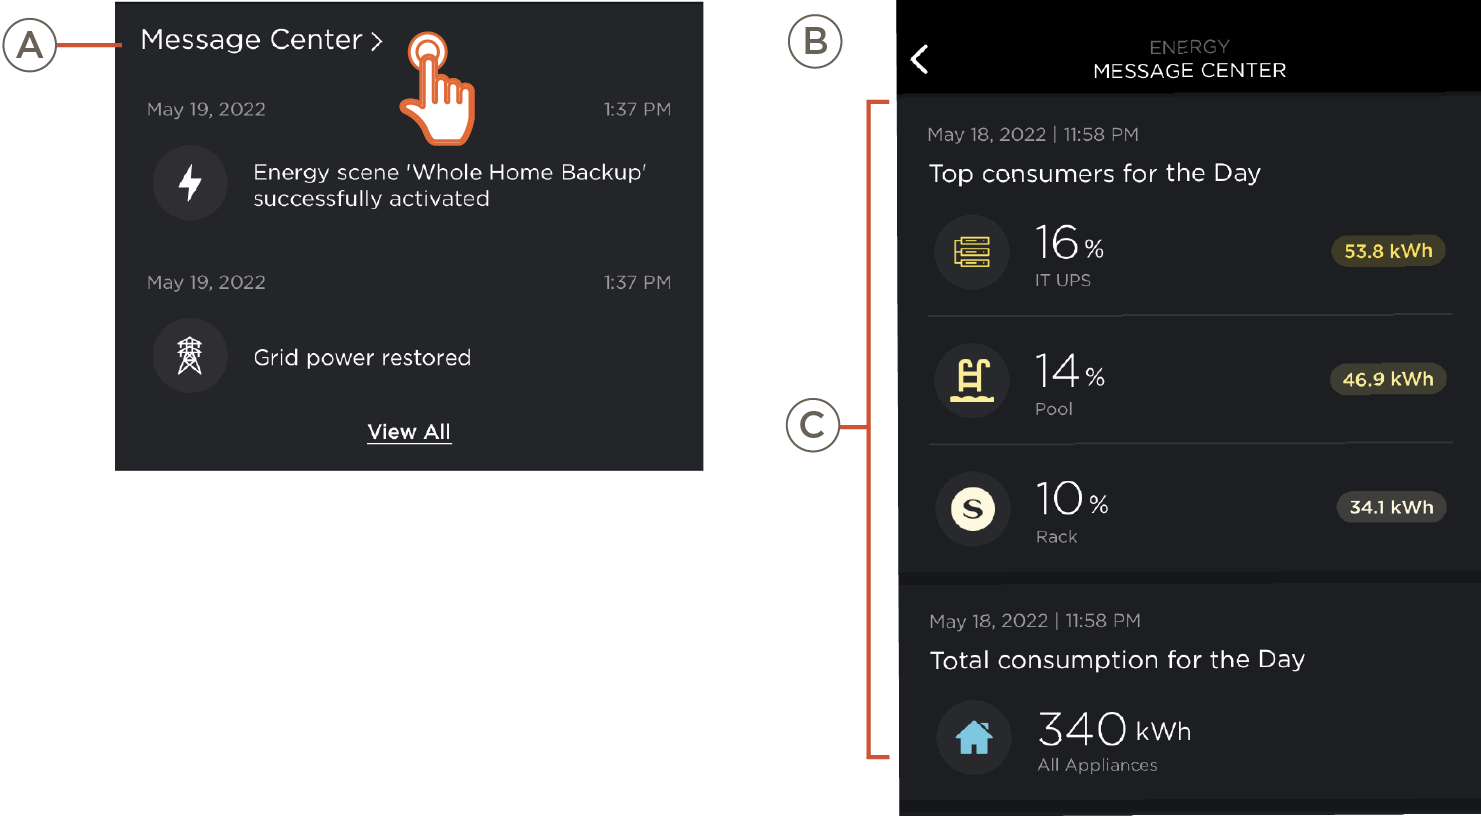 | A | Message Center Widget | The two most recent messages are represented here. Tapping will pull up a secondary page with a full view of the Message Center history. |
| B | Message Center Page | Displays a summary of Total Consumption and Top Consumers for the day and week, as well as a history of additional Energy Insights and Power Events. | |
| C | Message History | Allows the user to see a history of message center events and insights from up to 30 days by scrolling. |
3. Energy History
The Energy History page displays a graph of power usage over time. See below for descriptions.
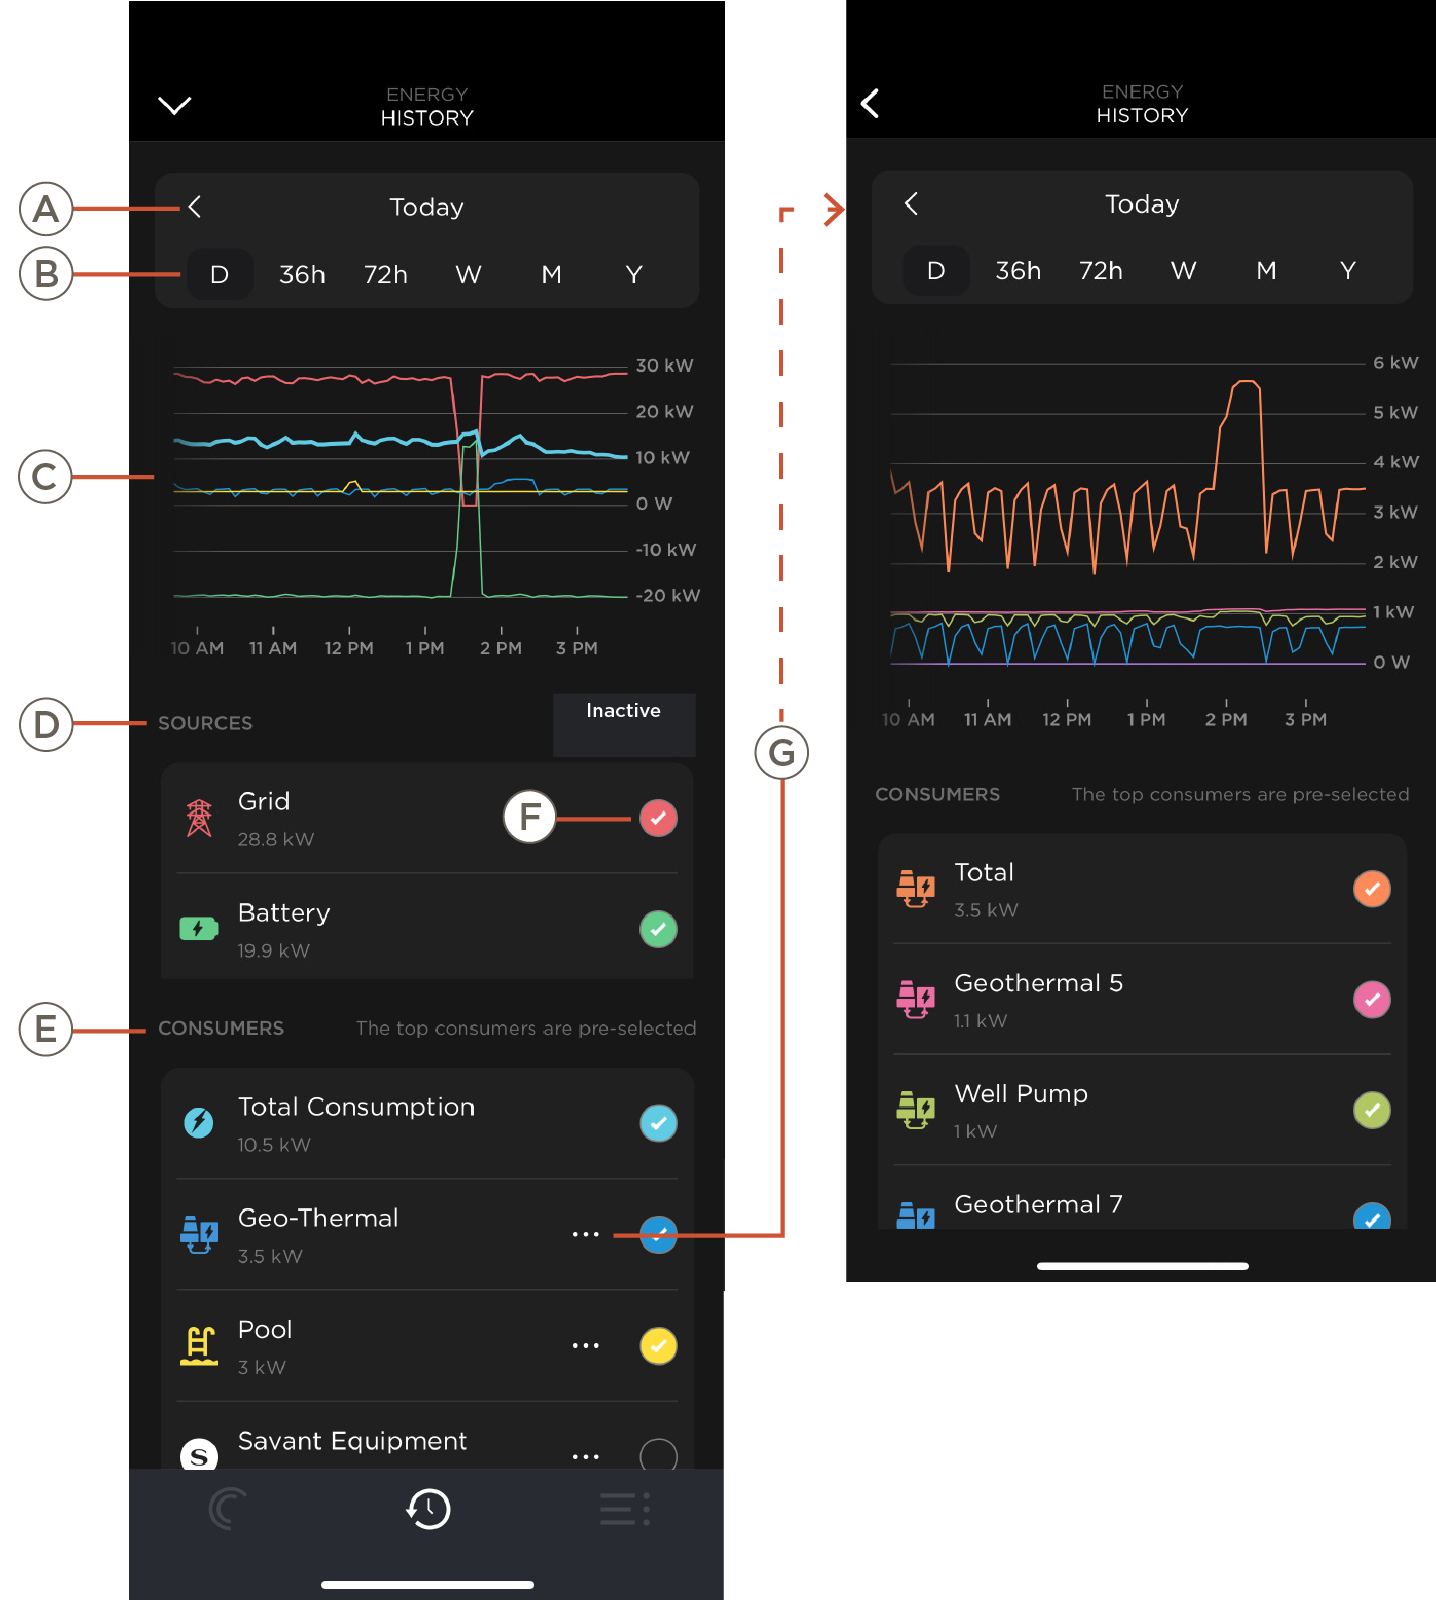
| A | Date | Select the arrows to navigate past Energy History info graphs. |
| B | Duration | Select the desired length of time displayed to display in the power consumption info graph below. |
| C | Energy Graph | Power usage over time. Pinch and zoom to view more detail. |
| D | Power Sources | Power Sources in the home. |
| E | Consumers | Energy Consumers in the home. |
| F | Show/Hide | Select to show in the History Graph. Only 6 may be selected at one time. |
| G | Consumer History | Tap the ellipses to view all circuits belonging to that group. |
4. Energy Scenes
The Energy Scenes page can be accessed by swiping left on the Savant App Home Screen or by selecting the Energy Scenes Widget. To create an Energy Scene, select Scenes then the “+” icon. Energy Scenes configured in the SP&L app can also be utilized here.
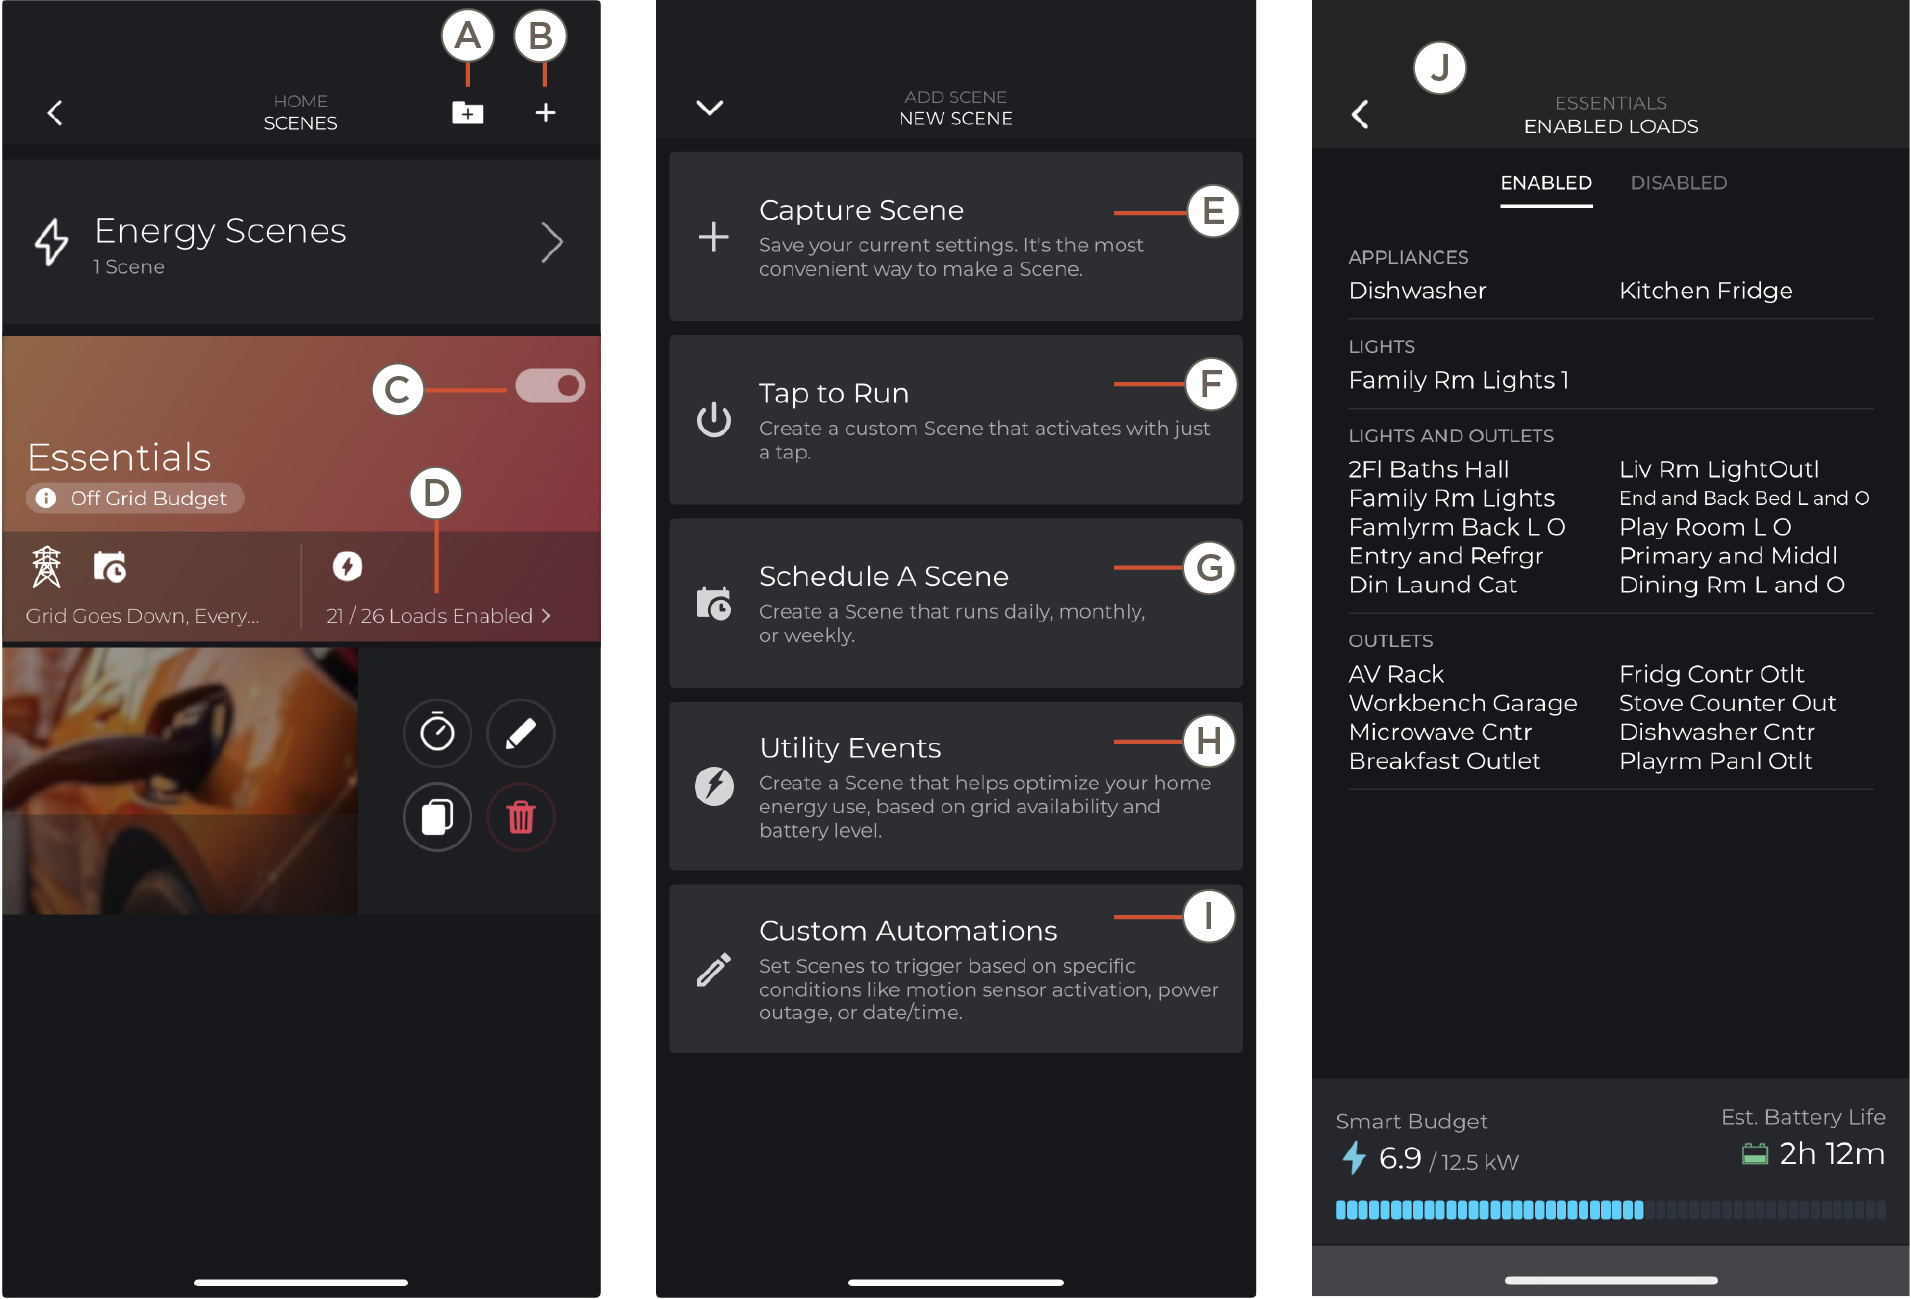
| A | Tap to add a Folder | Create a folder to customize and organize Scenes. |
| B | Tap to add a Scene | Add a new Energy Scene. |
| C | Enable/Disable Scene | Turn Scene On or Off. |
| D | Loads Enabled | See J |
| E | Capture Scene | Not applicable for Energy Scenes. See Capture Scene. |
| F | Tap to Run | Create a custom Scene that activates with a tap. See Tap to Run. |
| G | Schedule a Scene | Create a Scene that activates daily, monthly, or weekly. See Schedule a Scene. |
| H | Utility Events | Creates a Scene that optimizes home energy use based on grid availability and Smart Budget. See Utility Events. |
| I | Custom Automations | Set Scenes to trigger based on conditions such as; motion sensor activation, doors opening/closing, power outage, or date/time. See Custom Automations. |
| J | Enabled/Disable Loads | Enabled: Shows enabled loads in the selected Energy Scene. Disabled: Shows disabled loads in the selected Energy Scene. |
4.1 Capture Scene
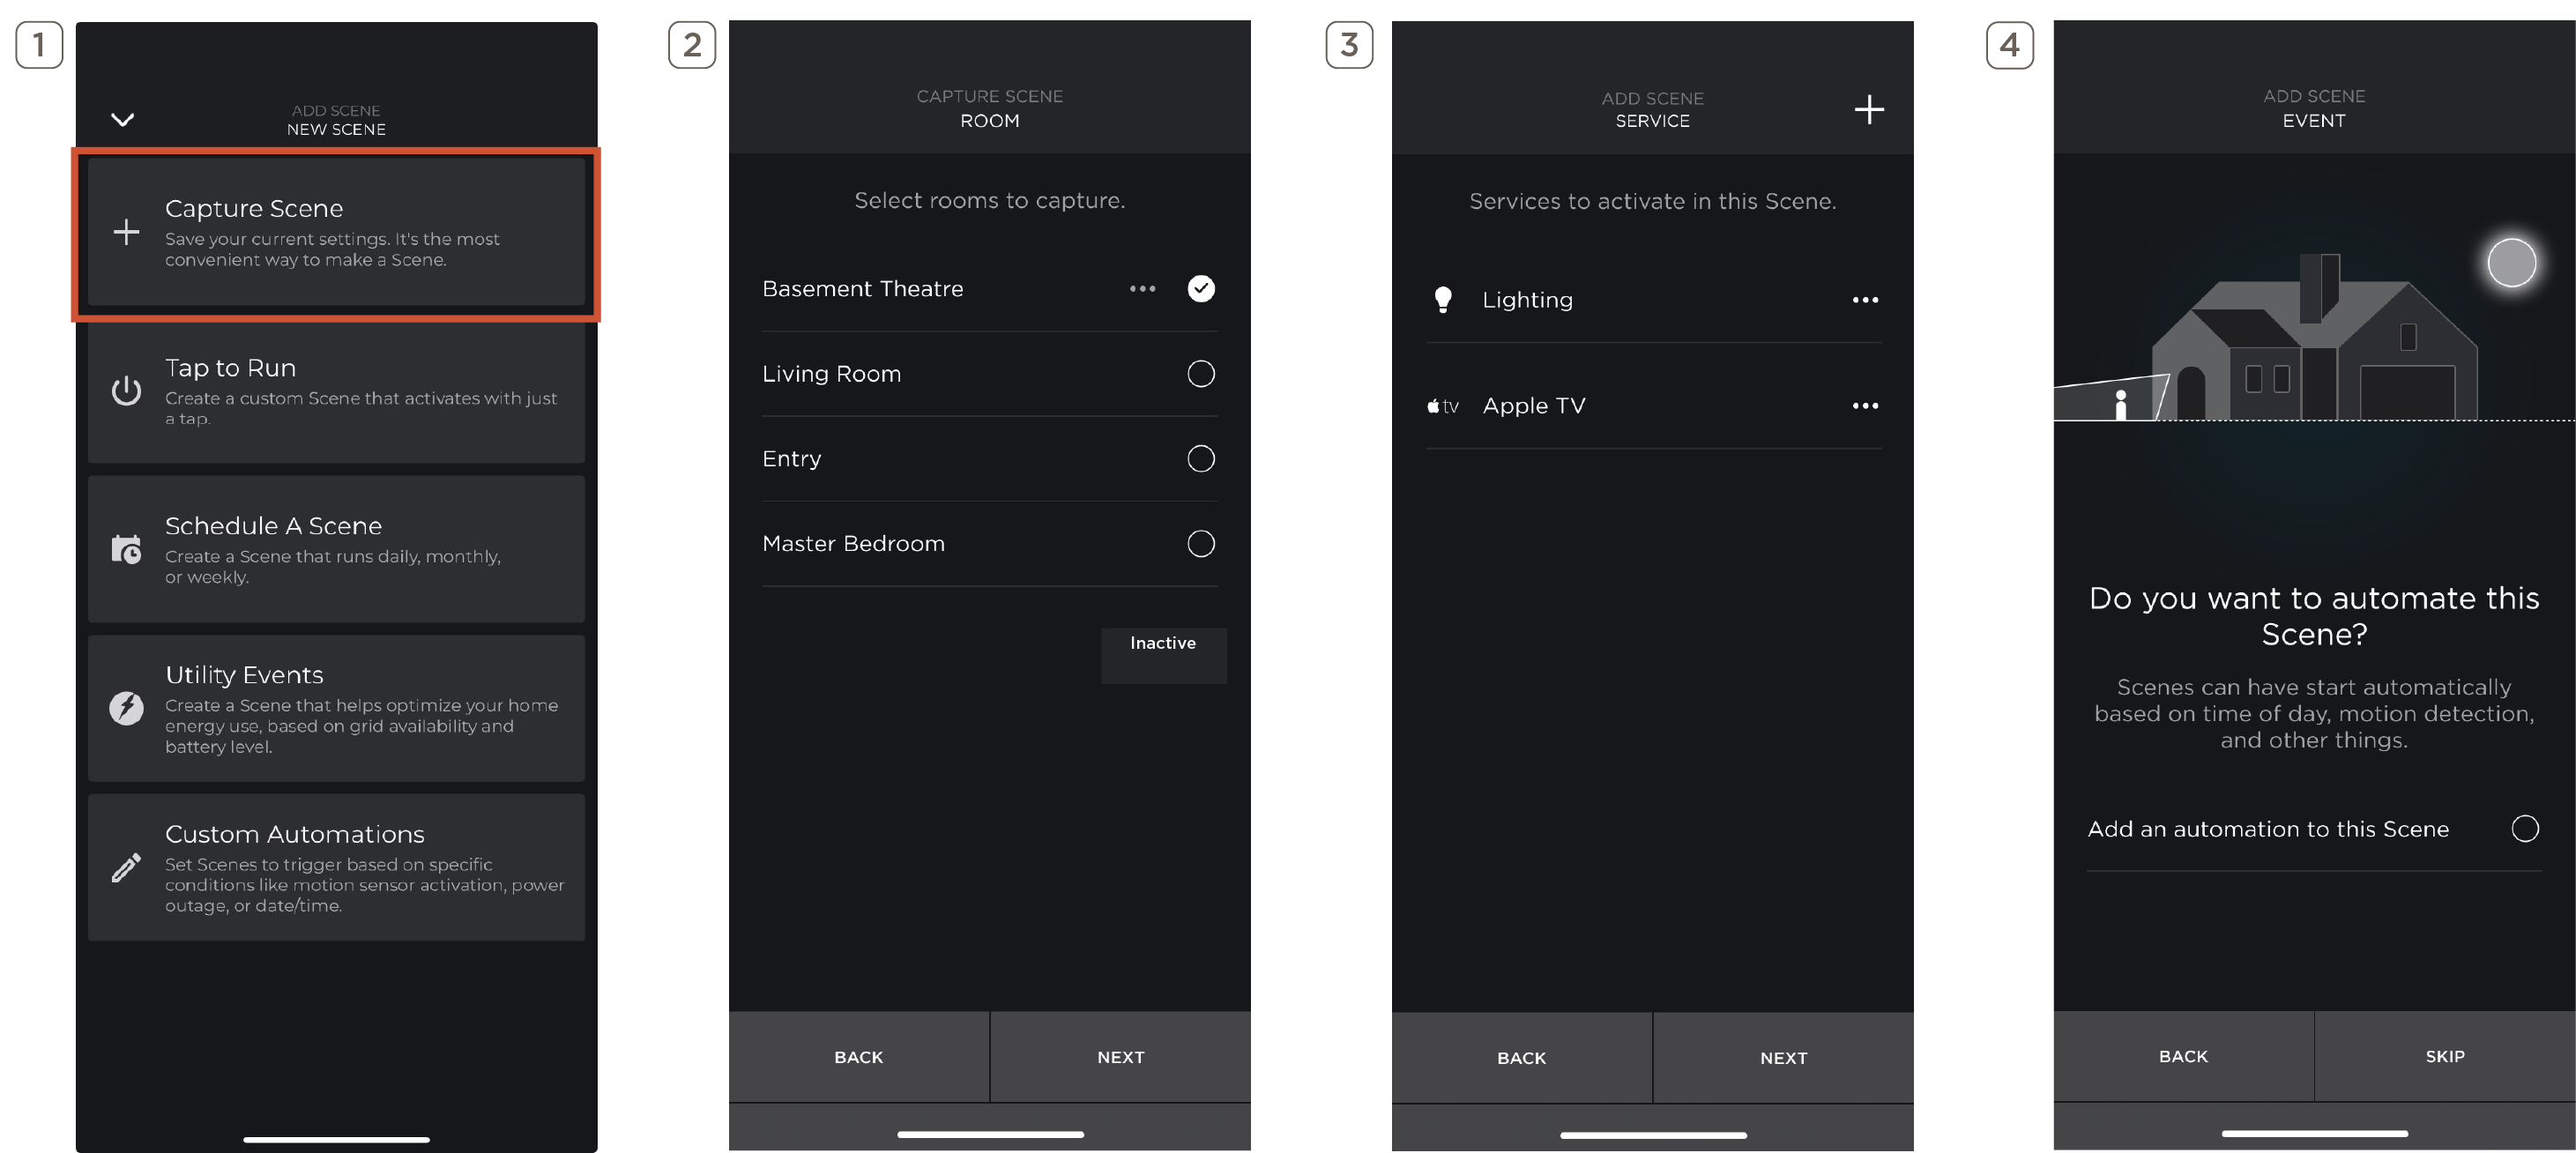
| 1 | From the Add New Scene screen, select Capture Scene. |
| 2 | Select Room(s) to capture. |
| 3 | Select Service(s) to activate when Scene is selected. |
| 4 | Select Add an automation to the Scene. This step can be skipped. See Custom Automations for more details on Automated Scenes. Select Next to name Scene, choose a photo, enable voice control, and save. |
4.2 Tap to Run
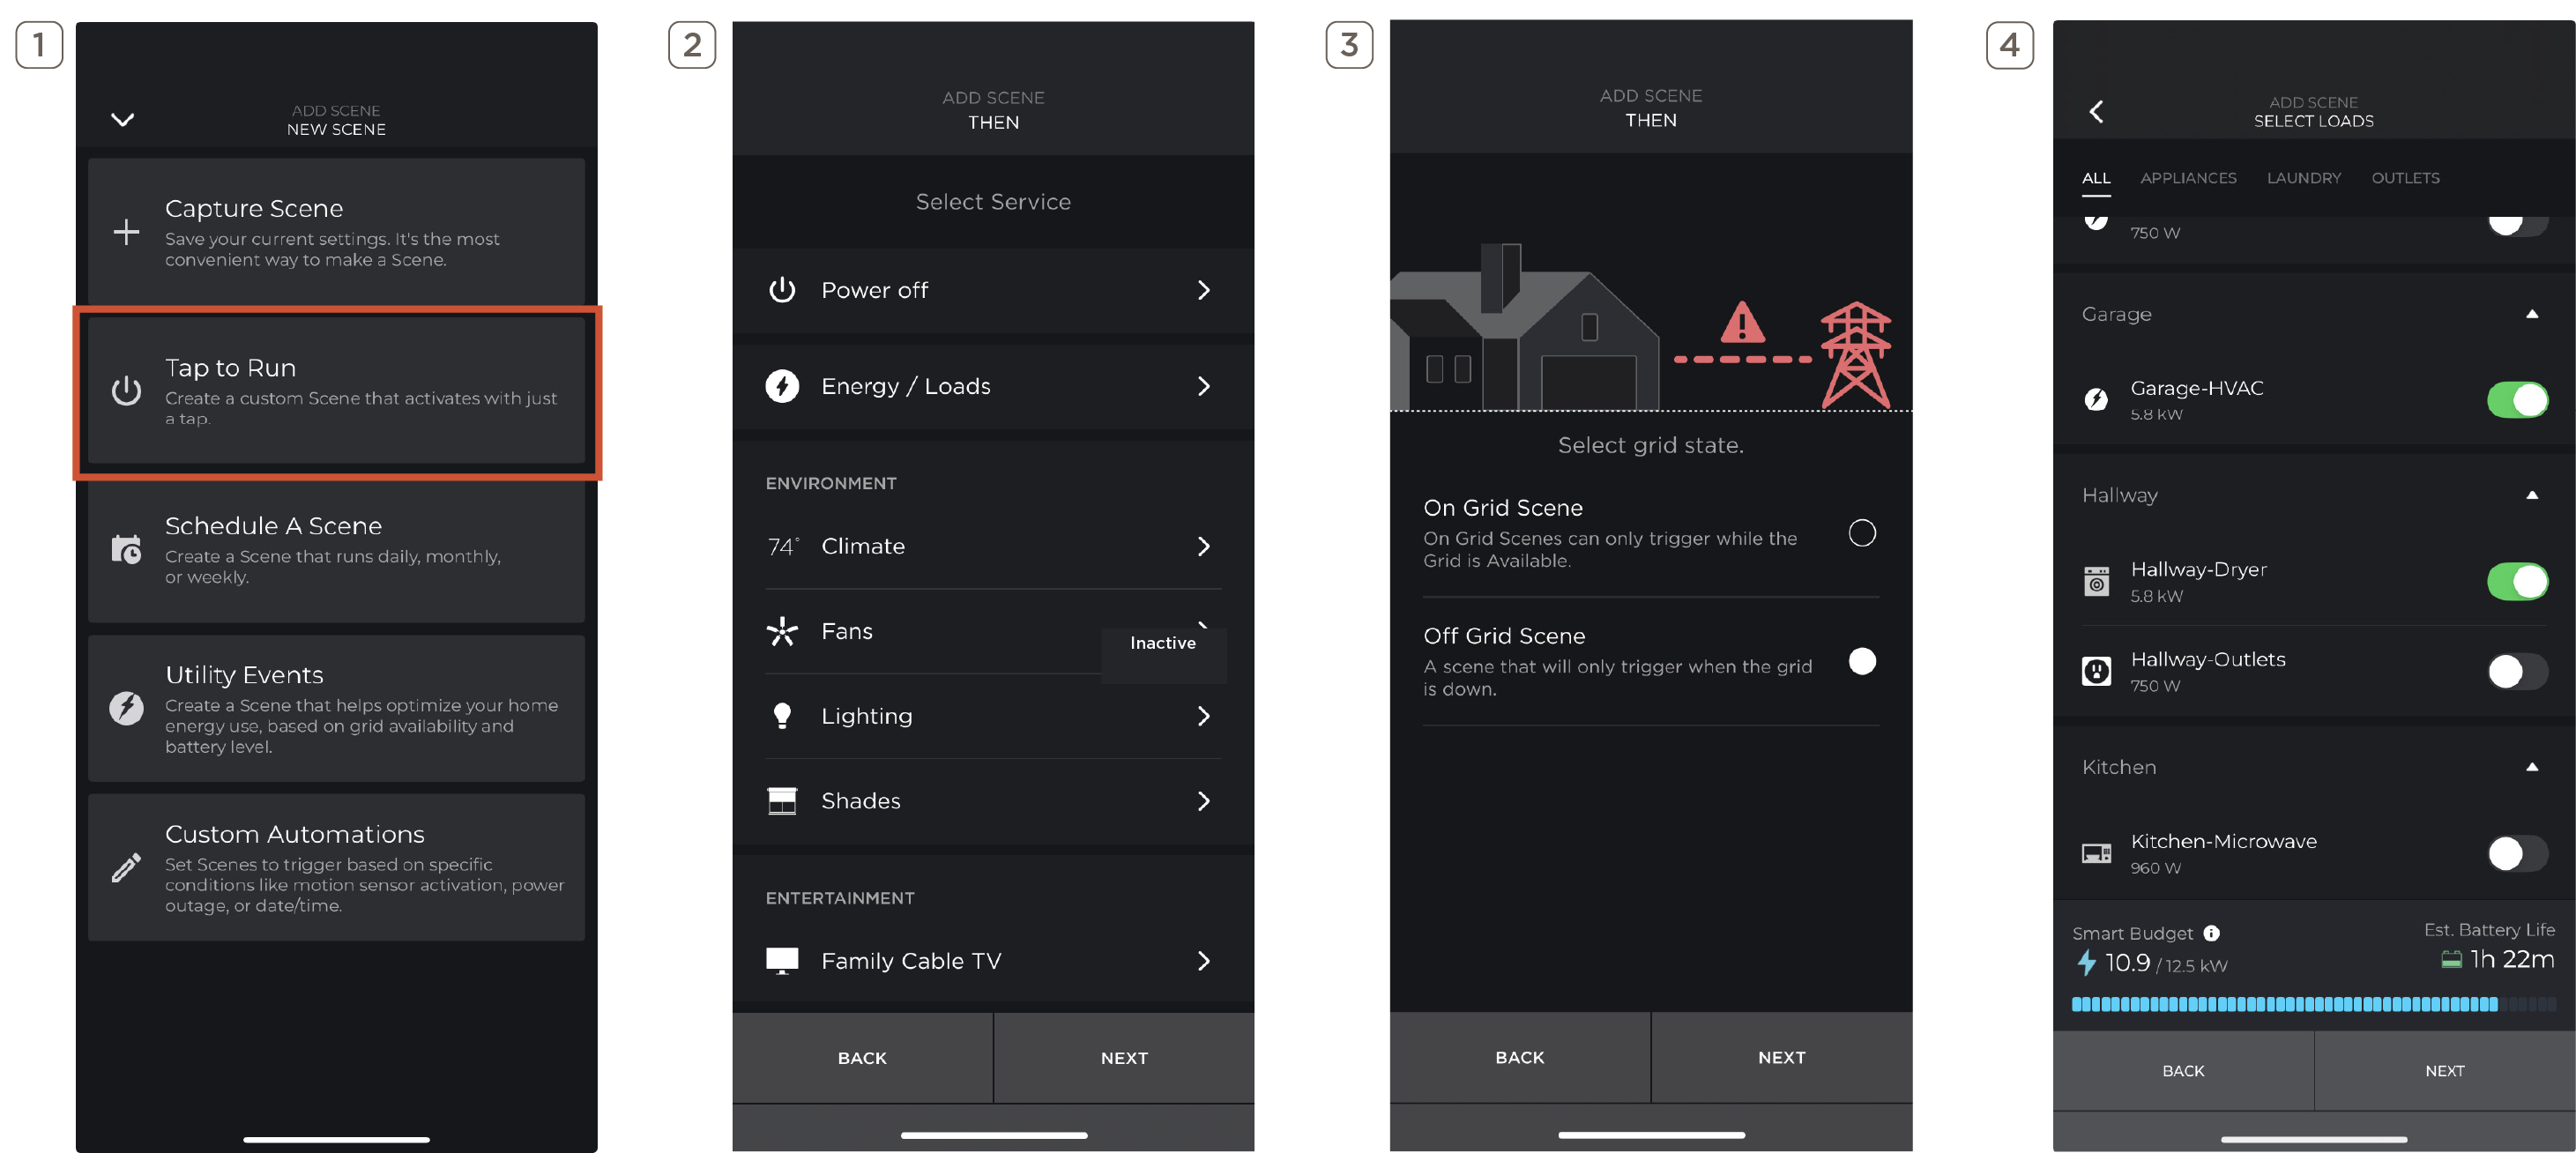
| 1 | From the Add New Scene screen, select Tap to Run. |
| 2 | Select Service. |
| 3 | Select Grid State. On Grid Scenes will only trigger when the Grid is available. Off Grid Scenes will only trigger when the Grid is down. |
| 4 | Select Load(s). Select Next to name, choose a photo, enable voice control, and save. |
4.3 Schedule a Scene
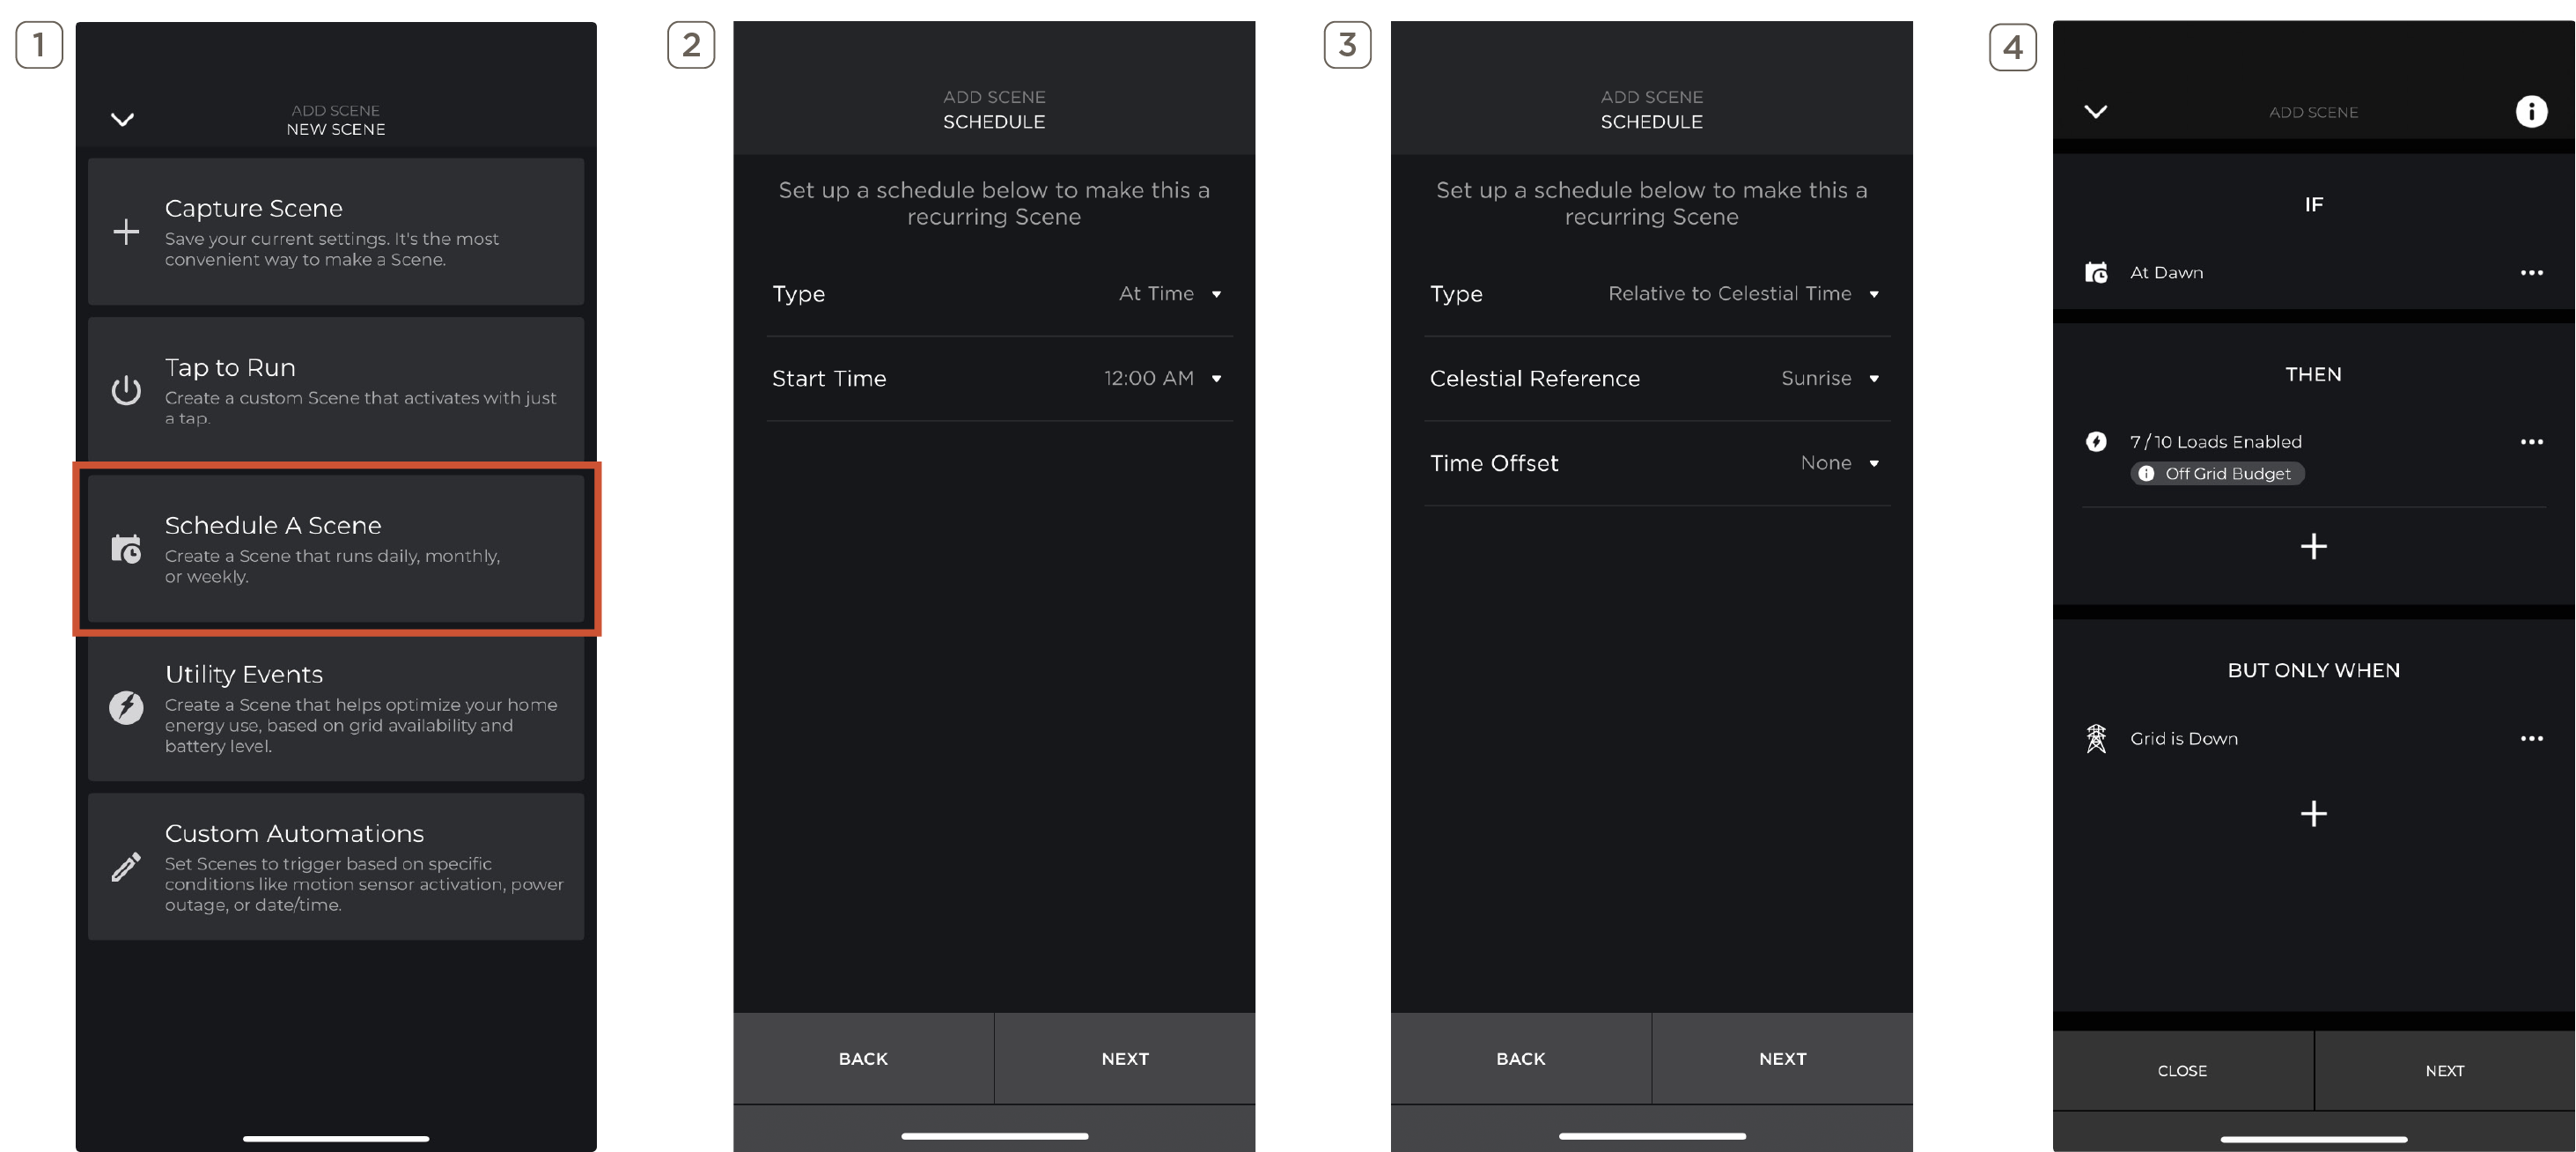
| 1 | From the Add New Scene screen, select Schedule a Scene. |
| 2 | Select Type of schedule to run. At Time runs the Scene exactly at time set. |
| 3 | If Relative to Celestial Time is selected, set the following parameters; Celestial Reference: Dawn, Sunrise, Dusk, or Sunset. Time Offset: adjusts time based on Celestial Reference chosen. |
| 4 | Configure Customized Automation for Scheduled Scene and save. See Custom Automations for more information. |
4.4 Utility Events
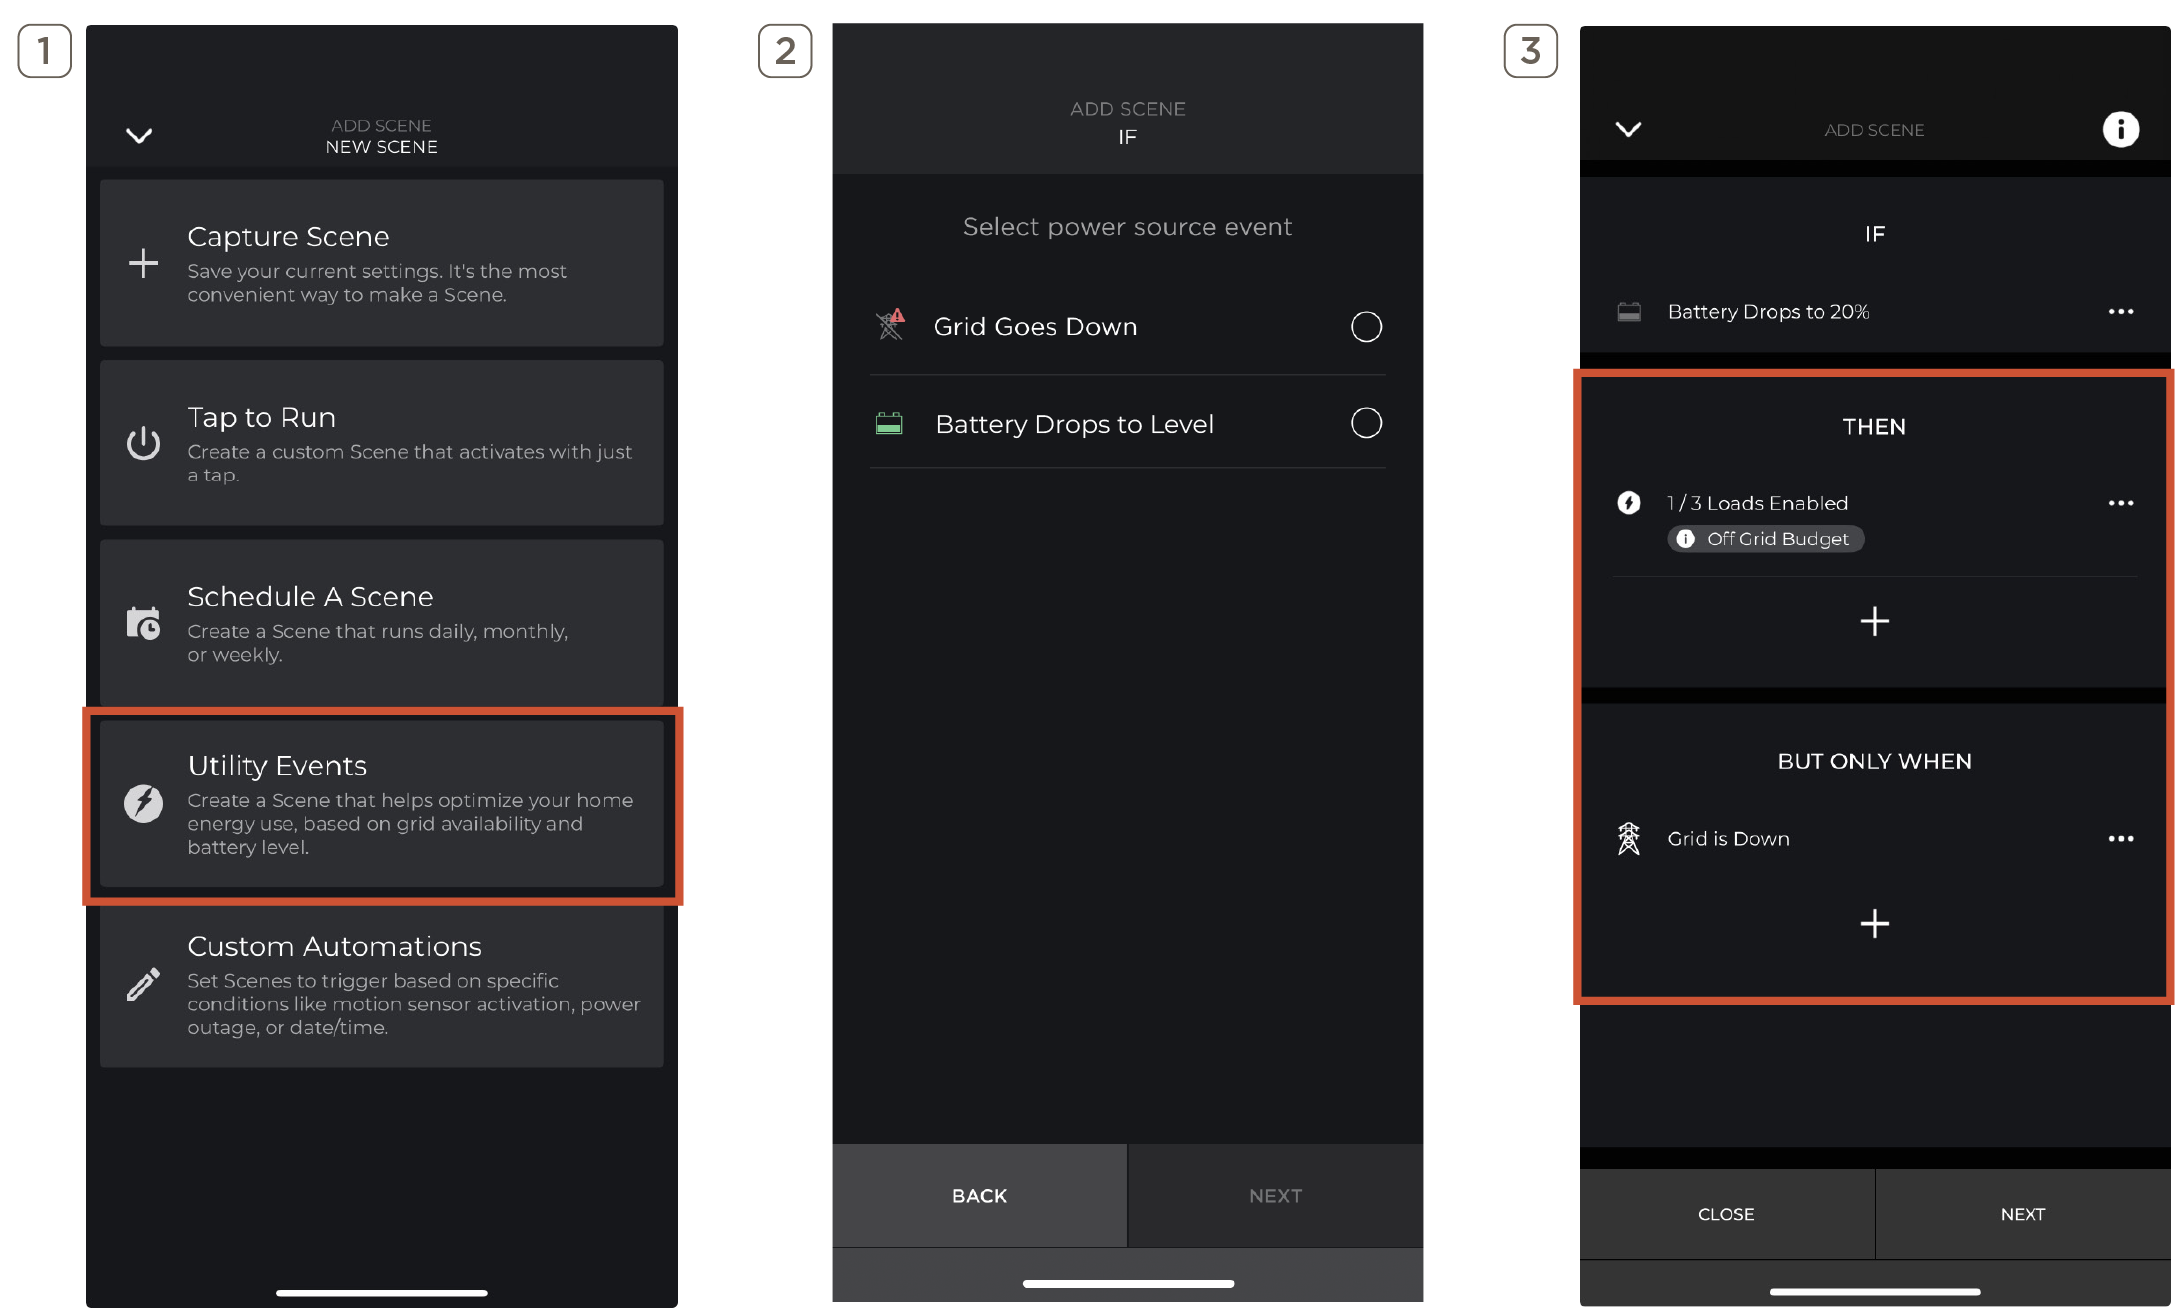
| 1 | From the Add New Scene screen, select Utility Events. |
| 2 |
Select the power source event trigger. For generator only homes, power source events will differ.
|
| 3 | Select and customize THEN and BUT ONLY WHEN to add conditions that will limit the Scene. Select Next to name, choose a photo, enable voice control, and save. See Custom Automations for more details on Automated Scenes. |
4.5 Custom Automations
Users can set up Custom Automations to trigger a Scene determined by set conditions. Automations have three customizable parts: IF, THEN and BUT ONLY WHEN parameters. For example: IF the front door opens, THEN turn on the lights, BUT ONLY WHEN it’s winter.
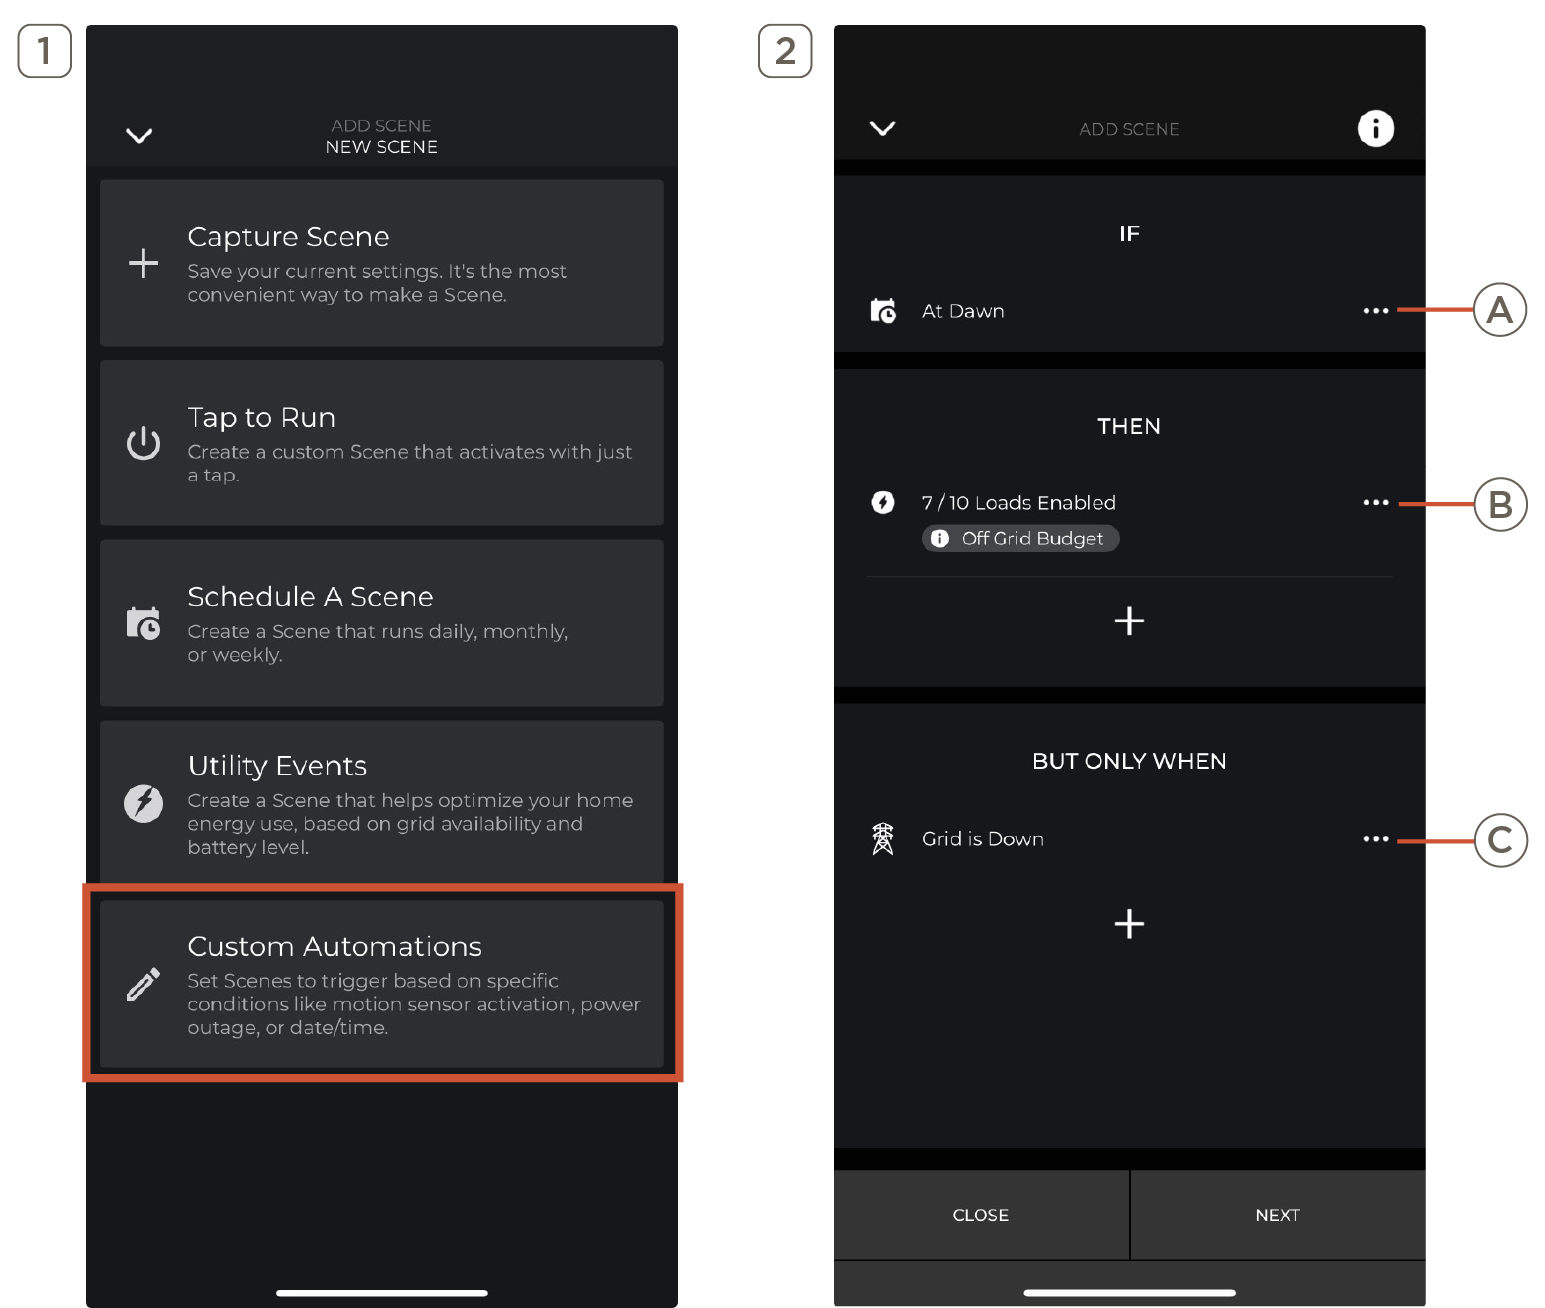
| 1 | From the Add New Scene screen, select Custom Automations. | |||||||||
| 2 | Customize the automation using the IF, THEN and BUT ONLY WHEN (optional) parameters.
| |||||||||
| 3 | Select and customize THEN and BUT ONLY WHEN to add conditions that will limit the Scene. Select Next to name, choose a photo, enable voice control, and save. See section 4.5 for more details on Automated Scenes. |
5. Push Notifications
Below are examples of push notifications sent to the users smart device when certain events occur. These notifications will only occur for supported system types when the trigger conditions are met.
| Notifications | Trigger | System Type |
|---|---|---|
| Grid outage, scene activating | Grid state changed to unavailable | Any system with a battery, generator, or microgrid |
| Grid restored, scene de-activating | Grid state changed to available | Any system with a battery, generator, or microgrid |
| Battery State of Charge | Battery reaches 10% and battery reaches 20% | Any system with a battery |
| Generator turning on | Generator is providing power to the loads | Microgrid system with generator backup |
| Generator turning off | Generator is no longer providing power to the loads | Microgrid system with generator backup |
| Generator providing power | Generator is providing power to the loads | Generator only |
| System de-activating Off Grid Mode | System is in island mode and battery reaches critical level | Whole-home microgrid |
| Conditional scene about to activate | Battery State of Charge is about to reach a level that triggers a conditional off grid scene | Any system with a battery or microgrid |
| Conditional scene has activated | Battery State of Charge has reached a level that triggers a conditional off grid scene | Any system with a battery or microgrid |
| Power capacity almost exceeds | Total consumption is reaching energy budget | Any system with a battery, generator, or microgrid |
| Power capacity exceed | Total consumption has exceeded energy budget | Any system with a battery, generator, or microgrid |
| Power Module(s) in ‘forced-on’ mode | A power module is been set from AUTO to ON | Whole-home backup or on-grid only systems. Setting is invalid for partial home systems. |
| Scene activation error | An off grid scene has failed to activate | Any system with a battery, generator, or microgrid |
| Charger_Name has stopped charging due to an error | EV charger has stopped charging due to an error. Check Message Center notifications for more information. | Any system with an EV charger |
| Charger_Name has stopped charging - Charge gun disconnected | EV charger has been disconnected | Any system with an EV charger |
| Charger_Name has ended its charging session | Charging session is complete | Any system with an EV charger |
| Charger_Name has failed to start | Any system with an EV charger |
6. Energy Settings
Energy Settings become available in the Savant App Settings menu when an Energy Storage System has been installed (requires SavantOS 11.1.4 or higher). Users can adjust the Backup Reserve State of Charge for Eco mode or Storm Watch mode in Savant Power Storage systems, as well as Generator Start and Stop State of Charge for systems including both Power Storage and a generator. Tap to edit the set percentage or use the sliders to adjust settings as desired.
![]() IMPORTANT!: Energy Settings are only relevant for homes with Savant Power Storage 20 or Savant Power Storage 50 systems.
IMPORTANT!: Energy Settings are only relevant for homes with Savant Power Storage 20 or Savant Power Storage 50 systems.
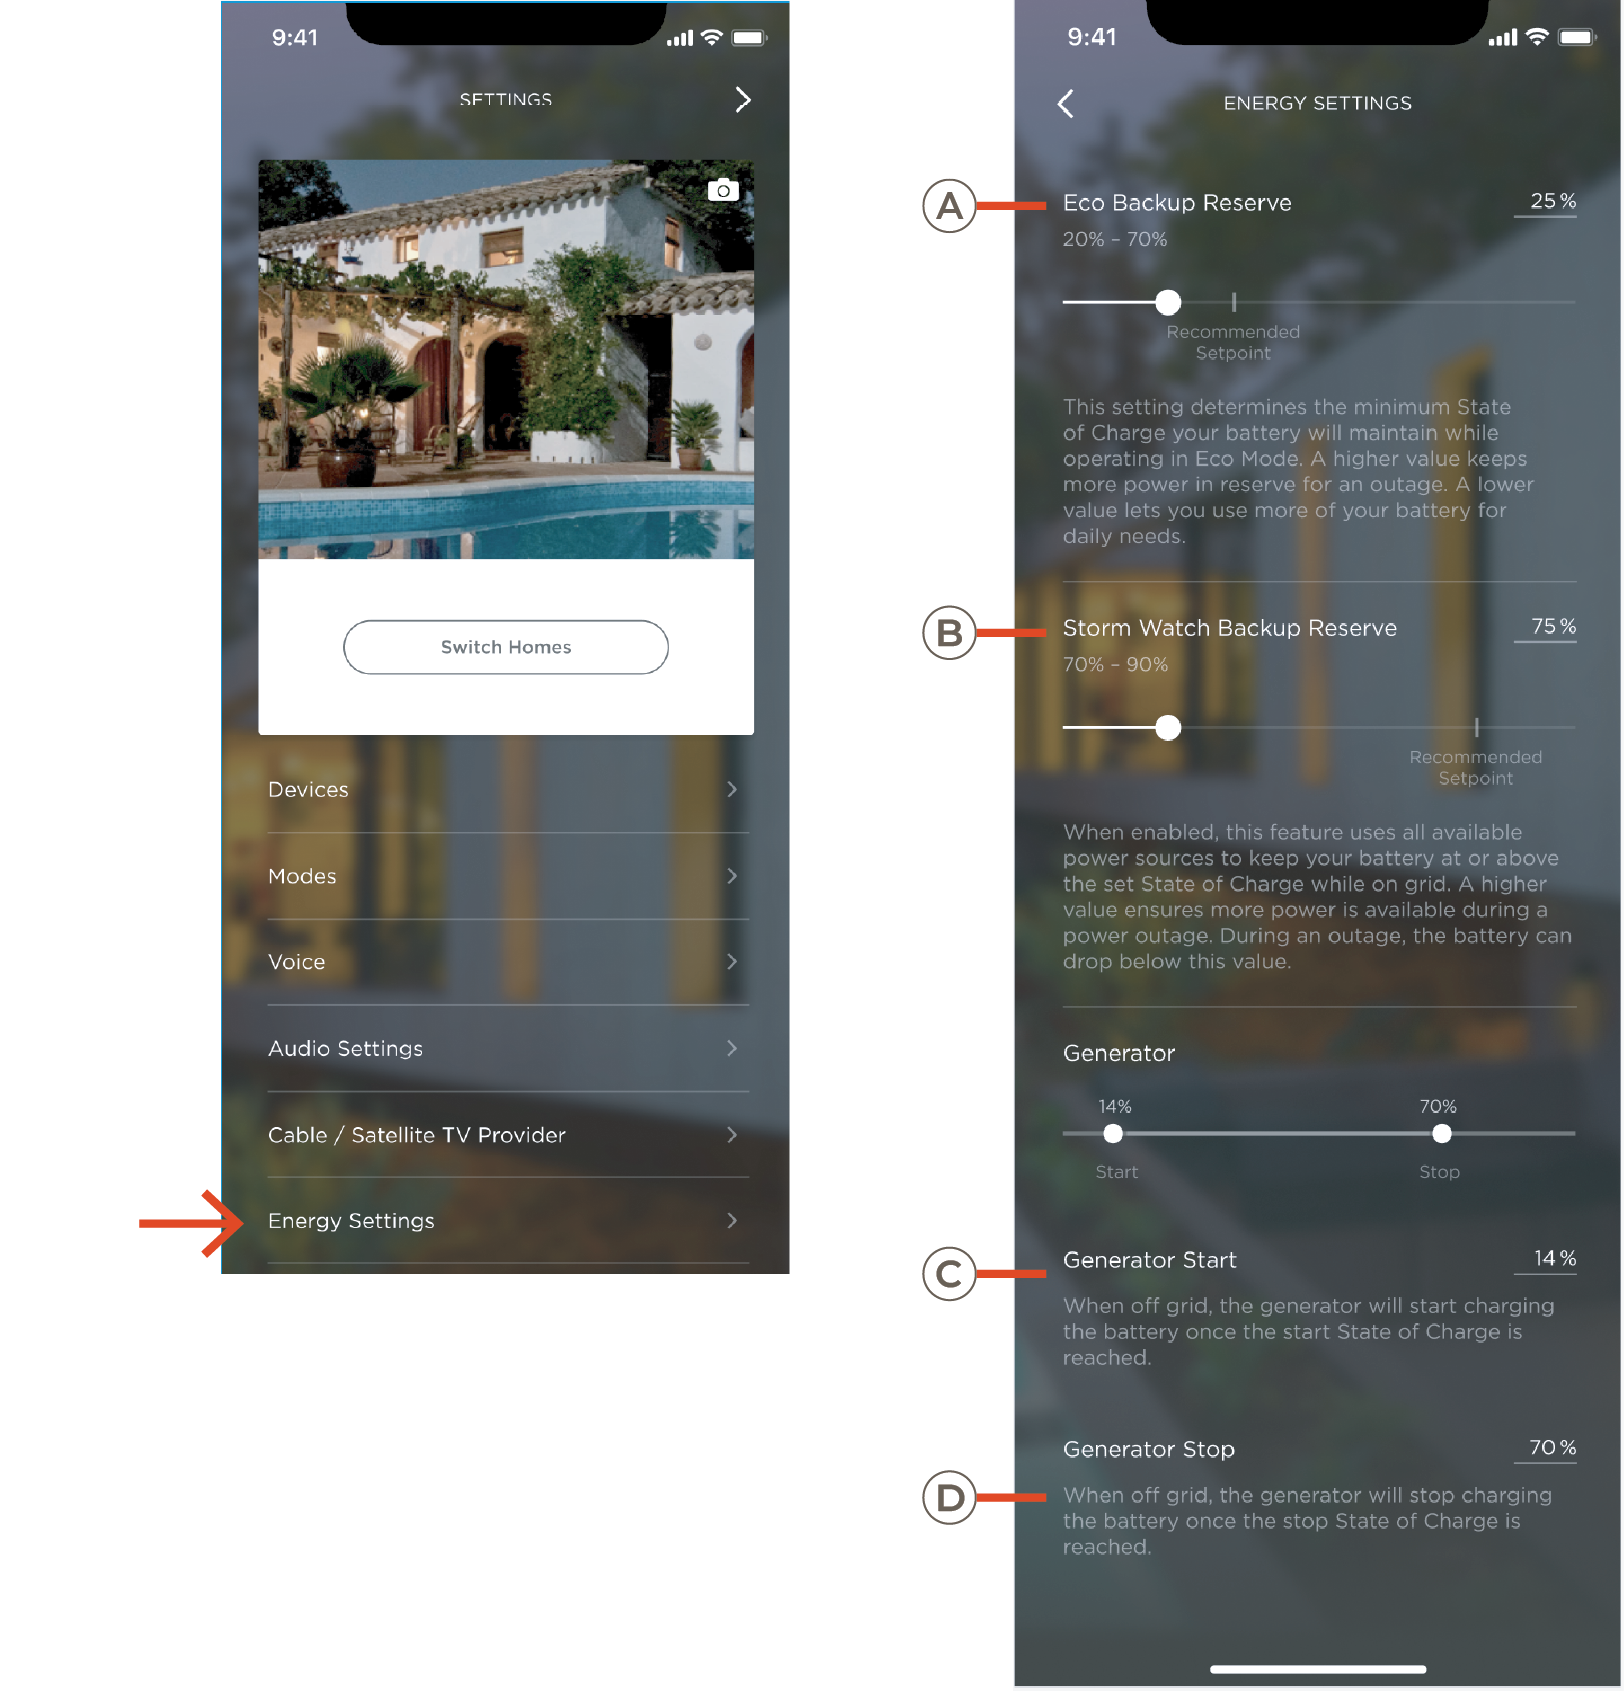
| A | Eco Backup Reserve | The minimum State of Charge the battery will maintain while operating in Eco Mode. A higher value keeps more power in reserve for an outage while lower value allows more flexible useage of your battery for daily needs. |
| B | Storm Watch Backup Reserve |
When enabled, the system directs energy from all available power sources to the battery to keep it at or above the set State of Charge while on grid. A higher value ensures more power is available during a power outage. NOTE: During an outage, the battery can drop below this value. |
| C | Generator Start |
When off grid, the generator will start charging the battery once the start State of Charge is reached. NOTE: Setting the Generator Start State of Charge higher then the Battery Backup Reserve or Storm Watch value may result in the generator starting immediately during a power outage. To prevent this, increase the Generator Start value or decrease the Battery Backup Reserve/Storm Watch value. |
| D | Generator Stop | When off grid, the generator will stop charging the battery once the stop State of Charge is reached. |
7. Firmware Updates
Savant Device Updates become available under Settings in the Savant App when there are modules in the Home. Updates to modules require connection to the Homes Wi-Fi and need to be preloaded. This process can take up to 2 hours to complete. During this time, the user may still control circuits, view energy data, control the Home, or exit the Savant App.

- Select Savant Device Updates under settings in the Savant app.
- Available updates will begin preloading. This process can take between 1-2 hours.
NOTE: To update firmware on Gen1 Modules, contact a Savant Dealer. - The Savant App will notify the user when it is ready. Select Update Now to continue.
- Select Complete Update.
NOTE: The user’s device will need to be connected to the home’s Wi-Fi to complete update. - Select devices to update or Update All.
NOTE: Any modules connected to the home’s circuit will power off to complete the update.